

Solana holds steady amid seller dominance and ongoing spot ETF withdrawals

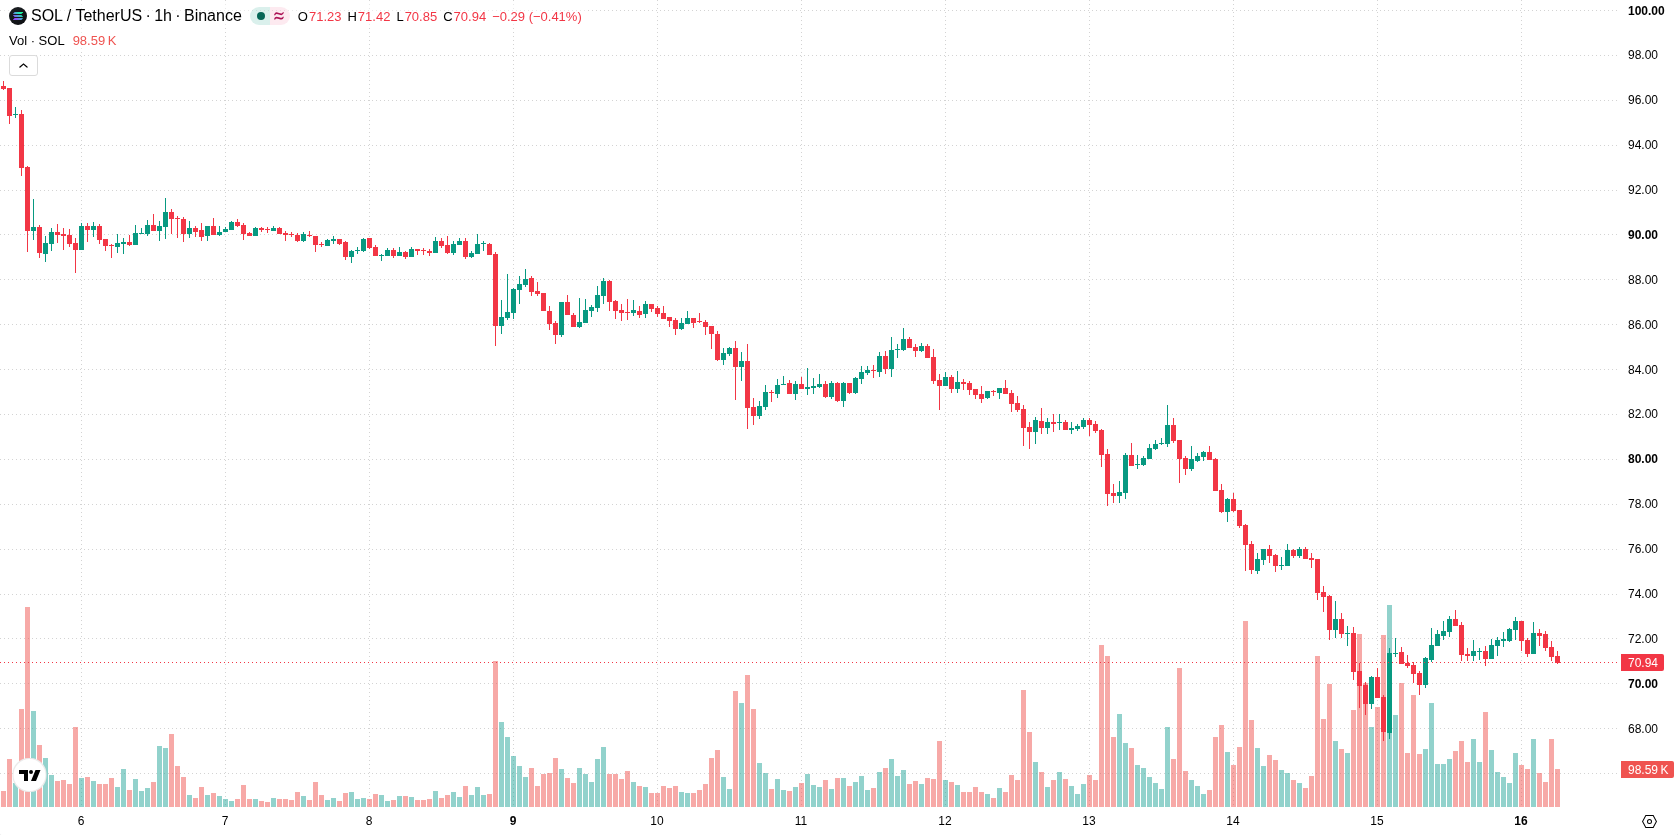
Solana (SOL) is trading at $70.99 following a modest uptick for the day. The asset remains below its key moving averages, which points to ongoing downward pressure.
 73.3
85.85
Highlights
- DTCC plans to link its tokenization service with Solana in the second half of 2027, allowing tokenized securities for eligible firms.
- Solana spot ETFs recorded net outflows of $32.05 million from November 9 to November 13, totaling six weeks of withdrawals.
- SOL/USD trades below key moving averages with strong downside momentum, expected to trade between $66.65 and $75.33 over the next 2 to 3 days.
ETF outflows and ecosystem upgrades shape demand amid tokenization news
The Depository Trust & Clearing Corporation (DTCC) has announced plans to integrate its tokenization service with the Solana network in the second half of 2027, granting firms the ability to tokenize eligible securities held at the Depository Trust Company, according to CryptoPotato. In the nearer term, data from Tokenpost and FXStreet revealed that Solana spot ETFs recorded $32.05 million in net outflows from November 9 to November 13 and have now experienced six consecutive weeks of investor withdrawals, reflecting an ongoing reduction in ETF-related demand. Solana's ecosystem development was in focus as the network activated 'Breakpoint mode' during its annual conference in London and introduced future-oriented initiatives, including the New Constellation upgrade and technical progress on the Firedancer validator, with sources such as Cryptobriefing and Crypto noting efforts to enhance efficiency and lower hardware requirements for node operators.
Downside momentum persists as technical resistance and seller control intensify
SOL/USD is trading below the MA-20 at $71.9, MA-50 at $72.34, and remains well beneath the long-term MA-200 at $88.85. The Ichimoku Kijun is positioned at $71.39 and serves as immediate resistance. MACD shows strong downside momentum, while ADX is neutral. Both RSI and CCI are in neutral territory, but Stoch RSI has entered oversold levels, pointing to a risk of an intraday rebound rather than a clear reversal. Bull/Bear Power is slightly negative, indicating intraday seller dominance, and the Awesome Oscillator remains neutral, offering no added confirmation for either direction.
Downside risk elevated as price outlook stays rangebound
Over the next two to three trading days, SOL/USD is projected to remain within a volatility band between $66.65 and $75.33. The probability of a decisive upward move is considered low, with the technical setup tilting risk toward additional downside. A break above the immediate resistance at $71.39 may shift sentiment to the upside, while a drop below the lower support at $66.65 would open scope for further price declines.
Earlier, analysts noted that ongoing ETF outflows and institutional selling remained the primary drivers of downside risk for Solana. The current article reinforces this bearish scenario with confirmation of sustained weekly ETF withdrawals and technical barriers at $71.39, highlighting $66.65 as the next level to monitor for additional potential downside.











-
 Afghanistan
-
 Albania
-
 Algeria
-
 Angola
-
 Argentina
-
 Armenia
-
 Australia
-
 Austria
-
 Azerbaijan
-
 Bahamas
-
 Bahrain
-
 Bangladesh
-
 Belarus
-
 Belgium
-
 Bolivia
-
 Botswana
-
 Brazil
-
 Brunei
-
 Bulgaria
-
 Cambodia
-
 Cameroon
-
 Canada
-
 Chile
-
 China
-
 Colombia
-
 Congo
-
 Costa Rica
-
 Cote d'Ivoire
-
 Croatia
-
 Cuba
-
 Cyprus
-
 Czechia
-
 DR Congo
-
 Denmark
-
 Dominican Republic
-
 Ecuador
-
 Egypt
-
 El Salvador
-
 Estonia
-
 Eswatini
-
 Ethiopia
-
 Finland
-
 France
-
 Georgia
-
 Germany
-
 Ghana
-
 Greece
-
 Haiti
-
 Hong Kong
-
 Hungary
-
 India
-
 Indonesia
-
 Iran, Islamic republic
-
 Iraq
-
 Ireland
-
 Israel
-
 Italy
-
 Jamaica
-
 Japan
-
 Jordan
-
 Kazakhstan
-
 Kenya
-
 Korea
-
 Kuwait
-
 Kyrgyzstan
-
 Laos
-
 Latvia
-
 Lebanon
-
 Lesotho
-
 Libya
-
 Lithuania
-
 Luxembourg
-
 Madagascar
-
 Malaysia
-
 Malta
-
 Mauritius
-
 Mexico
-
 Moldova
-
 Mongolia
-
 Montenegro
-
 Morocco
-
 Mozambique
-
 Myanmar
-
 Namibia
-
 Nepal
-
 Netherlands
-
 New Zealand
-
 Nigeria
-
 North Macedonia
-
 Norway
-
 Oman
-
 Pakistan
-
 Palestine
-
 Panama
-
 Papua New Guinea
-
 Paraguay
-
 Peru
-
 Philippines
-
 Poland
-
 Portugal
-
 Puerto Rico
-
 Qatar
-
 Reunion
-
 Romania
-
 Rwanda
-
 Saudi Arabia
-
 Serbia
-
 Singapore
-
 Slovakia
-
 Slovenia
-
 Somalia
-
 South Africa
-
 Spain
-
 Sri Lanka
-
 Sweden
-
 Switzerland
-
 Syria
-
 Taiwan
-
 Tajikistan
-
 Tanzania
-
 Thailand
-
 Trinidad and Tobago
-
 Tunisia
-
 Turkey
-
 UAE
-
 Uganda
-
 Ukraine
-
 United Kingdom
-
United States
-
 Uruguay
-
 Uzbekistan
-
 Venezuela
-
 Vietnam
-
 Yemen
-
 Zambia
-
 Zimbabwe
- Forex
- Crypto












