

Solana rises as ETF outflows caution investors over institutional risk context

Solana (SOL) is trading higher, with price motion to the upside while remaining below key moving averages on the 4H chart. A stretch of outflows from U.S. spot Solana ETFs has created institutional risk for the token. Traders are watching ETF flows for any signs of stabilization or renewed withdrawals as a gauge of institutional sentiment.
 72.92
86.82
Highlights
- U.S. spot Solana ETFs posted net outflows for seven straight sessions to November 13, 2026, showing persistent institutional redemptions.
- Reduced ETF demand signals lower institutional liquidity and risk appetite for Solana exposure via regulated products.
- SOL trades below significant moving averages, with strong sell signals from MACD and ADX indicating downward momentum pending a move above $75.46 resistance.
U.S. spot Solana ETF outflows signal institutional risk
According to Farside Investors, U.S. spot Solana ETFs experienced net outflows for seven consecutive trading days through November 13, 2026.
These ongoing ETF outflows point to institutional redemptions, reducing net demand for Solana exposure through regulated vehicles. As ETF demand softens, lower institutional presence can increase price pressure on SOL through diminished liquidity and risk appetite.
While this trend has introduced a risk channel for Solana, the recent daily move suggests market participants are weighing continued outflows against other factors, with no clear evidence that institutional selling is accelerating.
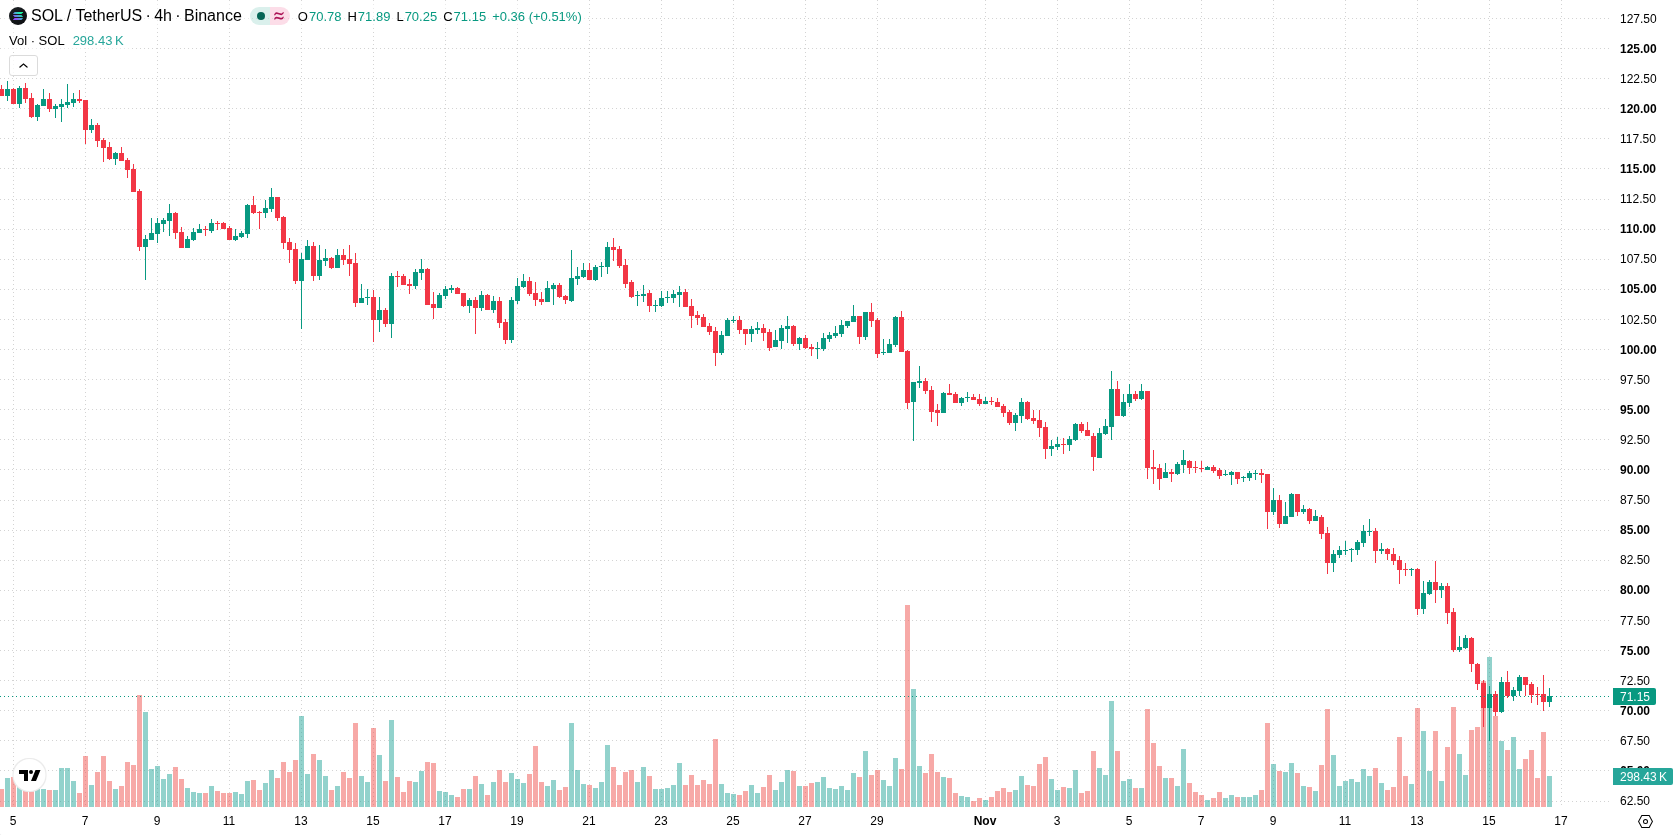
SOL below key 4H SMAs; bearish momentum prevails
On the 4H chart, SOL remains below the SMA-50 at $80.28 and the SMA-200 at $94.76, indicating a cautious technical outlook as long as the price is capped beneath these levels. The H4 Kijun at $75.46 serves as the nearest notable resistance on the current setup.
MACD and ADX on the 4H timeframe deliver strong sell signals, signaling downward momentum despite today's upward move. This divergence between technical signals and short-term price direction highlights the need for confirmation before any reversal is established.
ETF outflow stabilization versus $75.46 resistance for next move
Market direction hinges on whether ETF outflows stabilize or persist in the coming days. The first technical threshold for potential upside confirmation is resistance at $75.46. Sustained price action below this zone would point to limited recovery prospects, while a decisive move above it could reduce near-term downside risk.
Previously it was reported that institutional participation in Solana remains contingent on stronger onchain privacy features and compliance safeguards. The current environment of persistent ETF outflows underscores these institutional risks, making the stabilization or reversal of such outflows the primary condition to watch for Solana’s next directional move.










-
 Afghanistan
-
 Albania
-
 Algeria
-
 Angola
-
 Argentina
-
 Armenia
-
 Australia
-
 Austria
-
 Azerbaijan
-
 Bahamas
-
 Bahrain
-
 Bangladesh
-
 Belarus
-
 Belgium
-
 Bolivia
-
 Botswana
-
 Brazil
-
 Brunei
-
 Bulgaria
-
 Cambodia
-
 Cameroon
-
 Canada
-
 Chile
-
 China
-
 Colombia
-
 Congo
-
 Costa Rica
-
 Cote d'Ivoire
-
 Croatia
-
 Cuba
-
 Cyprus
-
 Czechia
-
 DR Congo
-
 Denmark
-
 Dominican Republic
-
 Ecuador
-
 Egypt
-
 El Salvador
-
 Estonia
-
 Eswatini
-
 Ethiopia
-
 Finland
-
 France
-
 Georgia
-
 Germany
-
 Ghana
-
 Greece
-
 Haiti
-
 Hong Kong
-
 Hungary
-
 India
-
 Indonesia
-
 Iran, Islamic republic
-
 Iraq
-
 Ireland
-
 Israel
-
 Italy
-
 Jamaica
-
 Japan
-
 Jordan
-
 Kazakhstan
-
 Kenya
-
 Korea
-
 Kuwait
-
 Kyrgyzstan
-
 Laos
-
 Latvia
-
 Lebanon
-
 Lesotho
-
 Libya
-
 Lithuania
-
 Luxembourg
-
 Madagascar
-
 Malaysia
-
 Malta
-
 Mauritius
-
 Mexico
-
 Moldova
-
 Mongolia
-
 Montenegro
-
 Morocco
-
 Mozambique
-
 Myanmar
-
 Namibia
-
 Nepal
-
 Netherlands
-
 New Zealand
-
 Nigeria
-
 North Macedonia
-
 Norway
-
 Oman
-
 Pakistan
-
 Palestine
-
 Panama
-
 Papua New Guinea
-
 Paraguay
-
 Peru
-
 Philippines
-
 Poland
-
 Portugal
-
 Puerto Rico
-
 Qatar
-
 Reunion
-
 Romania
-
 Rwanda
-
 Saudi Arabia
-
 Serbia
-
 Singapore
-
 Slovakia
-
 Slovenia
-
 Somalia
-
 South Africa
-
 Spain
-
 Sri Lanka
-
 Sweden
-
 Switzerland
-
 Syria
-
 Taiwan
-
 Tajikistan
-
 Tanzania
-
 Thailand
-
 Trinidad and Tobago
-
 Tunisia
-
 Turkey
-
 UAE
-
 Uganda
-
 Ukraine
-
 United Kingdom
-
United States
-
 Uruguay
-
 Uzbekistan
-
 Venezuela
-
 Vietnam
-
 Yemen
-
 Zambia
-
 Zimbabwe
- Forex
- Crypto












