

Will BTC hold $59,784 support amid volatility and heightened selling pressure?

Bitcoin (BTC) is trading at $63,345, marking a daily decline of 2.01%. The asset currently sits above its key short-term moving averages but remains below its medium- and long-term averages, suggesting an uneven technical landscape.
 63571.5
71514.01
Highlights
- Spot Bitcoin ETFs saw $240 million in outflows on November 17, mainly from BlackRock IBIT, increasing near-term selling pressure.
- Goldman Sachs holds $1.283 billion in spot Bitcoin ETFs and Wells Fargo doubled its Bitcoin ETF holdings in Q3 2026, but recent redemptions reduce prior institutional accumulation effects.
- BTC/USD is expected to trade between $59,784 and $65,471 over the next 2 to 3 days, with short-term buyer dominance offset by weak momentum signals and a 65% probability of further losses.
ETF outflows intensify selling despite earlier institutional accumulation
Spot Bitcoin ETFs experienced over $240 million in outflows on November 17, primarily from BlackRock’s IBIT, removing liquidity from the market and amplifying near-term selling pressure, according to Cryptobriefing. While Goldman Sachs disclosed $1.283 billion in spot Bitcoin ETF holdings in its November 2026 13F filing, this substantial position reflects earlier institutional accumulation rather than current flows. Similarly, Wells Fargo doubled its Bitcoin ETF exposure in Q3 2026 by adding about 14,600 BTC, yet these historic investments have been offset by the latest round of ETF redemptions.
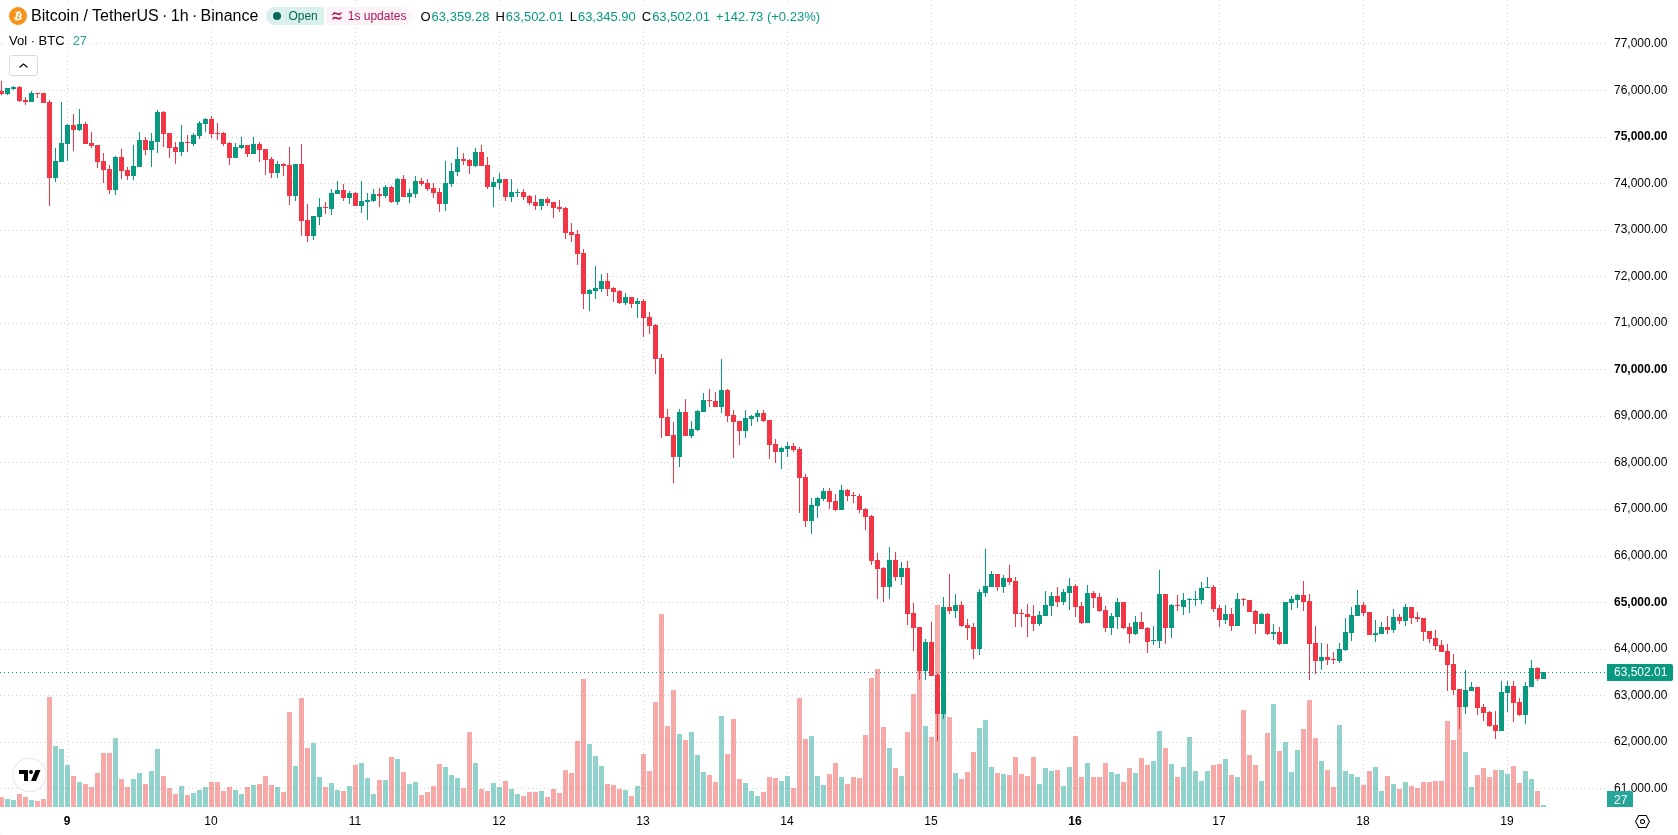
Mixed momentum as resistance and neutral indicators challenge trend clarity
BTC/USD is trading above the H1 SMA-20 at $63,270, while continuing to hold below the H1 SMA-50 at $64,021 and the D1 SMA-200 at $72,772. The Ichimoku Kijun at $63,507 is acting as immediate resistance for price action. Among oscillators, MACD indicates strong sell pressure, with ADX showing that sellers remain in control. RSI and CCI are both in neutral territory, while Stoch RSI has entered the overbought zone, raising the risk of a short-term pullback. Bull/Bear Power stands positive at 473.3, pointing to current buyer dominance, but the Awesome Oscillator remains neutral, reflecting a lack of clear momentum direction. Overall, technical signals are mixed, with conflicting oscillator and momentum readings.
Downside risk dominates as volatility keeps price range-bound
In the short term, BTC/USD is expected to remain volatile within a range of $59,784 to $65,471 over the next several trading days. The probability of a downward move is higher at 65%, while an upward recovery is assigned a 35% chance, leaving further losses more likely for now. A sustained bullish scenario would require a decisive breakout above resistance at $63,507, whereas a bearish scenario could develop if price breaks down below $59,784 support. The baseline scenario calls for a continuation of range-bound, sideways trading within this typical volatility band relative to current levels.
Earlier, analysts noted that deep institutional participation in Bitcoin ETFs persisted despite intermittent waves of outflows and short-term price weakness. Recent technical readings now emphasize the importance of $63,507 as a pivotal resistance level, with a sustained move above it required to signal any potential shift from the current volatile trading range.











-
 Afghanistan
-
 Albania
-
 Algeria
-
 Angola
-
 Argentina
-
 Armenia
-
 Australia
-
 Austria
-
 Azerbaijan
-
 Bahamas
-
 Bahrain
-
 Bangladesh
-
 Belarus
-
 Belgium
-
 Bolivia
-
 Botswana
-
 Brazil
-
 Brunei
-
 Bulgaria
-
 Cambodia
-
 Cameroon
-
 Canada
-
 Chile
-
 China
-
 Colombia
-
 Congo
-
 Costa Rica
-
 Cote d'Ivoire
-
 Croatia
-
 Cuba
-
 Cyprus
-
 Czechia
-
 DR Congo
-
 Denmark
-
 Dominican Republic
-
 Ecuador
-
 Egypt
-
 El Salvador
-
 Estonia
-
 Eswatini
-
 Ethiopia
-
 Finland
-
 France
-
 Georgia
-
 Germany
-
 Ghana
-
 Greece
-
 Haiti
-
 Hong Kong
-
 Hungary
-
 India
-
 Indonesia
-
 Iran, Islamic republic
-
 Iraq
-
 Ireland
-
 Israel
-
 Italy
-
 Jamaica
-
 Japan
-
 Jordan
-
 Kazakhstan
-
 Kenya
-
 Korea
-
 Kuwait
-
 Kyrgyzstan
-
 Laos
-
 Latvia
-
 Lebanon
-
 Lesotho
-
 Libya
-
 Lithuania
-
 Luxembourg
-
 Madagascar
-
 Malaysia
-
 Malta
-
 Mauritius
-
 Mexico
-
 Moldova
-
 Mongolia
-
 Montenegro
-
 Morocco
-
 Mozambique
-
 Myanmar
-
 Namibia
-
 Nepal
-
 Netherlands
-
 New Zealand
-
 Nigeria
-
 North Macedonia
-
 Norway
-
 Oman
-
 Pakistan
-
 Palestine
-
 Panama
-
 Papua New Guinea
-
 Paraguay
-
 Peru
-
 Philippines
-
 Poland
-
 Portugal
-
 Puerto Rico
-
 Qatar
-
 Reunion
-
 Romania
-
 Rwanda
-
 Saudi Arabia
-
 Serbia
-
 Singapore
-
 Slovakia
-
 Slovenia
-
 Somalia
-
 South Africa
-
 Spain
-
 Sri Lanka
-
 Sweden
-
 Switzerland
-
 Syria
-
 Taiwan
-
 Tajikistan
-
 Tanzania
-
 Thailand
-
 Trinidad and Tobago
-
 Tunisia
-
 Turkey
-
 UAE
-
 Uganda
-
 Ukraine
-
 United Kingdom
-
United States
-
 Uruguay
-
 Uzbekistan
-
 Venezuela
-
 Vietnam
-
 Yemen
-
 Zambia
-
 Zimbabwe
- Forex
- Crypto












