

Litecoin technical analysis: Downward momentum persists below $37.18 support

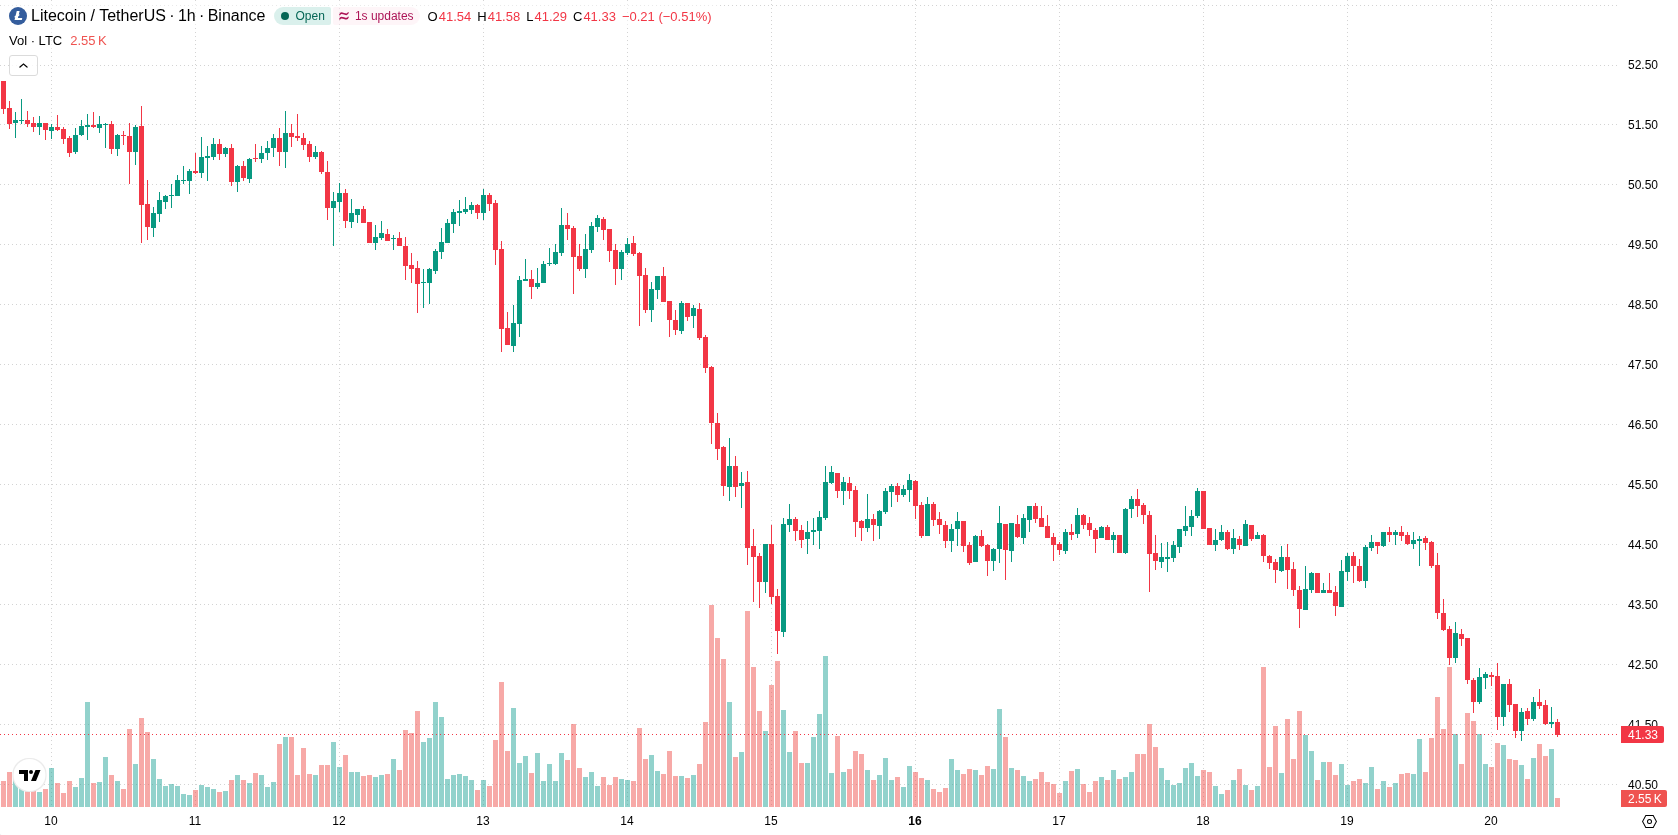
Litecoin (LTC) is trading at $41.32, reflecting a sharp daily decline of 7.02%. The asset now sits below both short- and medium-term moving averages, further distancing itself from longer-term trend lines.
 42.51
49.64
Highlights
- Litecoin dropped below major daily moving averages, a technical breakdown that can trigger systematic selling and reduce stability.
- Open interest in Litecoin derivatives contracts shrank to $300 million, lowering liquidity and heightening reaction to bearish pressure.
- Technical signals indicate persistent downside momentum with a projected trading range of $37.18 to $43.10 and low probability of a rebound.
Systematic selling and liquidity drop as technical breakdown persists
Litecoin dropped below its major daily exponential moving averages, a key technical breakdown that, according to Tronweekly, can force systematic selling and heighten negative market sentiment. In addition, open interest in Litecoin derivatives contracts has fallen to around $300 million, further reducing market liquidity and amplifying reactions to ongoing bearish pressure. These shifts suggest a less stable trading environment as market participants recalibrate risk exposure in response to changing technical signals.
Mixed momentum and seller control amid technical resistance zones
On the technical front, LTC trades below H1 SMA-20 at $42.16 and H1 SMA-50 at $43.39, underlining persistent short- and medium-term selling pressure. The price remains well beneath D1 SMA-200 at $51.64, while the Ichimoku Kijun on the daily timeframe at $43.01 serves as immediate resistance. MACD maintains a strong sell signal, with ADX also pointing to further downside momentum. RSI and CCI are each neutral, but Stochastic RSI is overbought, hinting at a potential short-term correction. Bull/Bear Power is notably negative at -0.29, confirming seller dominance intraday, while the Awesome Oscillator sits neutral—together, these readings highlight mixed momentum amid heavy volatility.
Further downside risk as upside breakout probability remains weak
Looking forward over the next 2–3 trading days, LTC is expected to trade within a volatility band between $37.18 and $43.10. The probability of a decisive upside move remains very low, while the likelihood of further declines is elevated. Stabilization within this range is anticipated as the base case, with any bullish scenario contingent on a sustained breach above immediate resistance. Conversely, a break below support could see downside momentum accelerate further.
Earlier, analysts noted that Litecoin was under sustained bearish pressure, with negative momentum indicators and declining derivatives activity reinforcing an ongoing downtrend. The latest technical breakdown and decreased liquidity now sharpen downside risks, making a decisive move below near-term support the key scenario for traders to monitor in the coming sessions.











-
 Afghanistan
-
 Albania
-
 Algeria
-
 Angola
-
 Argentina
-
 Armenia
-
 Australia
-
 Austria
-
 Azerbaijan
-
 Bahamas
-
 Bahrain
-
 Bangladesh
-
 Belarus
-
 Belgium
-
 Bolivia
-
 Botswana
-
 Brazil
-
 Brunei
-
 Bulgaria
-
 Cambodia
-
 Cameroon
-
 Canada
-
 Chile
-
 China
-
 Colombia
-
 Congo
-
 Costa Rica
-
 Cote d'Ivoire
-
 Croatia
-
 Cuba
-
 Cyprus
-
 Czechia
-
 DR Congo
-
 Denmark
-
 Dominican Republic
-
 Ecuador
-
 Egypt
-
 El Salvador
-
 Estonia
-
 Eswatini
-
 Ethiopia
-
 Finland
-
 France
-
 Georgia
-
 Germany
-
 Ghana
-
 Greece
-
 Haiti
-
 Hong Kong
-
 Hungary
-
 India
-
 Indonesia
-
 Iran, Islamic republic
-
 Iraq
-
 Ireland
-
 Israel
-
 Italy
-
 Jamaica
-
 Japan
-
 Jordan
-
 Kazakhstan
-
 Kenya
-
 Korea
-
 Kuwait
-
 Kyrgyzstan
-
 Laos
-
 Latvia
-
 Lebanon
-
 Lesotho
-
 Libya
-
 Lithuania
-
 Luxembourg
-
 Madagascar
-
 Malaysia
-
 Malta
-
 Mauritius
-
 Mexico
-
 Moldova
-
 Mongolia
-
 Montenegro
-
 Morocco
-
 Mozambique
-
 Myanmar
-
 Namibia
-
 Nepal
-
 Netherlands
-
 New Zealand
-
 Nigeria
-
 North Macedonia
-
 Norway
-
 Oman
-
 Pakistan
-
 Palestine
-
 Panama
-
 Papua New Guinea
-
 Paraguay
-
 Peru
-
 Philippines
-
 Poland
-
 Portugal
-
 Puerto Rico
-
 Qatar
-
 Reunion
-
 Romania
-
 Rwanda
-
 Saudi Arabia
-
 Serbia
-
 Singapore
-
 Slovakia
-
 Slovenia
-
 Somalia
-
 South Africa
-
 Spain
-
 Sri Lanka
-
 Sweden
-
 Switzerland
-
 Syria
-
 Taiwan
-
 Tajikistan
-
 Tanzania
-
 Thailand
-
 Trinidad and Tobago
-
 Tunisia
-
 Turkey
-
 UAE
-
 Uganda
-
 Ukraine
-
 United Kingdom
-
United States
-
 Uruguay
-
 Uzbekistan
-
 Venezuela
-
 Vietnam
-
 Yemen
-
 Zambia
-
 Zimbabwe
- Forex
- Crypto












