

Large wallet withdrawal leaves PEPE under pressure as price holds above long-term support

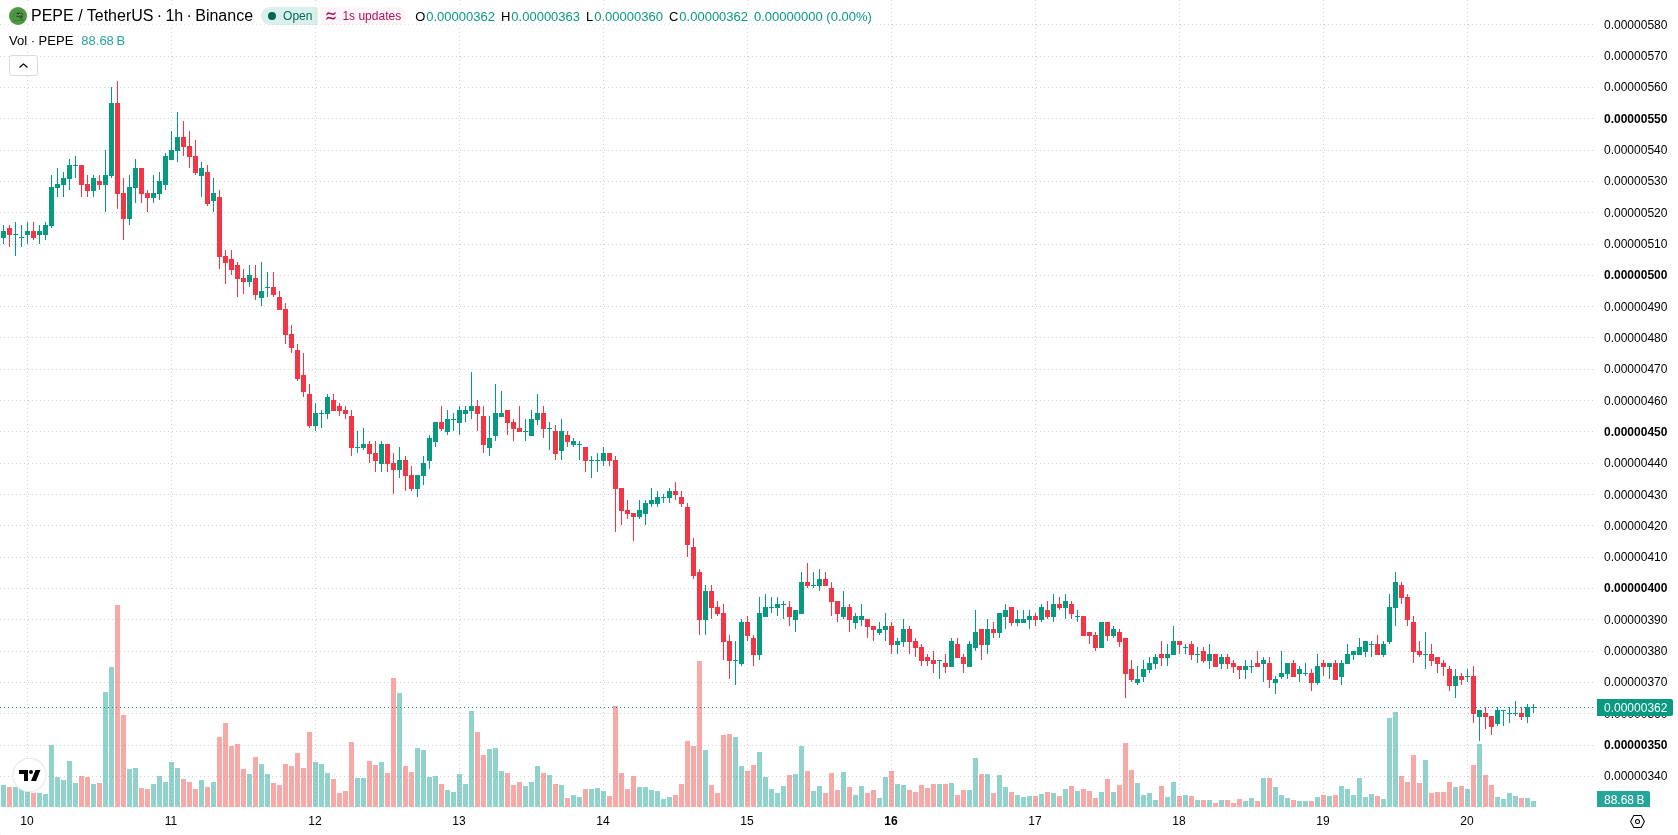
Pepe (PEPE) is trading at $0.0000036, down 8.38% on the day. The price sits below its key short- and medium-term moving averages but remains above long-term levels, signaling a divergence between short-term weakness and longer-term support.
 0.0538
0.054450
Highlights
- A new wallet withdrew 1.9 trillion Pepe tokens worth $7.15 million from Binance, reducing exchange supply and impacting market liquidity.
- Spot trading volume on Binance reached $42.68 million, 0.40 times its five-day average, increasing potential for sharp price moves.
- Pepe trades with short- and medium-term bearish momentum and high volatility, likely remaining in a $0.00000295 to $0.000003779 range with a 79% probability of further downside.
Supply withdrawal and low volume as volatility risks rise
A new wallet withdrew 1.9 trillion Pepe tokens valued at $7.15 million from Binance over the past two days, a move reported by Tokenpost that reduces available supply on the exchange and can contribute to thinner order books and heightened intraday volatility. Tokenpost also highlighted that spot trading volume on Binance was subdued, reaching just $42.68 million or 0.40 times its five-day average, indicating less active participation and amplifying price fluctuations. Technical attention has centered on Pepe retesting a weekly falling wedge pattern, possibly shaping near-term positioning. Cryptonews additionally noted an increase in market capitalization, though price action has remained under broader selling pressure.
Mixed technical signals as sellers dominate and oscillators stay neutral
The PEPE/USD pair trades below the H1 SMA-20 at $0.000003673 and H1 SMA-50 at $0.00000374, while price remains above the D1 SMA-200 at $0.000003546. The Ichimoku Kijun sits at $0.00000378 and now forms immediate resistance. MACD and ADX both indicate active selling pressure, while RSI, Stoch RSI, and CCI are neutral, offering no strong momentum reversal signals at this time. Bull/Bear Power is negative, confirming intraday seller dominance, and the Awesome Oscillator remains neutral, underscoring the lack of trend reinforcement. Price action centers near the midpoint of today's range, with high volatility and a recent gap down producing mixed technical signals between short-term weakness and neutral oscillators.
Downside favored within volatile band barring key resistance breakthrough
Over the next two to three trading days, the expected range for PEPE/USD is $0.00000295 to $0.000003779. Model probabilities suggest a 79% chance of a move lower within this band, and a 21% likelihood of an upside attempt. The base scenario is continued trade within this volatility band relative to current levels. A break above $0.00000378 would suggest a potential bullish reversal, while a drop below near-term support would likely extend the decline.
Earlier, analysts noted that Pepe showed notable buyer dominance and accumulation activity, supporting a bullish outlook amid reduced exchange supply. However, with current price action showing short-term weakness below key moving averages and selling pressure prevailing, traders should closely watch for a break above $0.00000378 or a move below near-term support to signal the next directional trend.






Latest PEPE/USD News




-
 Afghanistan
-
 Albania
-
 Algeria
-
 Angola
-
 Argentina
-
 Armenia
-
 Australia
-
 Austria
-
 Azerbaijan
-
 Bahamas
-
 Bahrain
-
 Bangladesh
-
 Belarus
-
 Belgium
-
 Bolivia
-
 Botswana
-
 Brazil
-
 Brunei
-
 Bulgaria
-
 Cambodia
-
 Cameroon
-
 Canada
-
 Chile
-
 China
-
 Colombia
-
 Congo
-
 Costa Rica
-
 Cote d'Ivoire
-
 Croatia
-
 Cuba
-
 Cyprus
-
 Czechia
-
 DR Congo
-
 Denmark
-
 Dominican Republic
-
 Ecuador
-
 Egypt
-
 El Salvador
-
 Estonia
-
 Eswatini
-
 Ethiopia
-
 Finland
-
 France
-
 Georgia
-
 Germany
-
 Ghana
-
 Greece
-
 Haiti
-
 Hong Kong
-
 Hungary
-
 India
-
 Indonesia
-
 Iran, Islamic republic
-
 Iraq
-
 Ireland
-
 Israel
-
 Italy
-
 Jamaica
-
 Japan
-
 Jordan
-
 Kazakhstan
-
 Kenya
-
 Korea
-
 Kuwait
-
 Kyrgyzstan
-
 Laos
-
 Latvia
-
 Lebanon
-
 Lesotho
-
 Libya
-
 Lithuania
-
 Luxembourg
-
 Madagascar
-
 Malaysia
-
 Malta
-
 Mauritius
-
 Mexico
-
 Moldova
-
 Mongolia
-
 Montenegro
-
 Morocco
-
 Mozambique
-
 Myanmar
-
 Namibia
-
 Nepal
-
 Netherlands
-
 New Zealand
-
 Nigeria
-
 North Macedonia
-
 Norway
-
 Oman
-
 Pakistan
-
 Palestine
-
 Panama
-
 Papua New Guinea
-
 Paraguay
-
 Peru
-
 Philippines
-
 Poland
-
 Portugal
-
 Puerto Rico
-
 Qatar
-
 Reunion
-
 Romania
-
 Rwanda
-
 Saudi Arabia
-
 Serbia
-
 Singapore
-
 Slovakia
-
 Slovenia
-
 Somalia
-
 South Africa
-
 Spain
-
 Sri Lanka
-
 Sweden
-
 Switzerland
-
 Syria
-
 Taiwan
-
 Tajikistan
-
 Tanzania
-
 Thailand
-
 Trinidad and Tobago
-
 Tunisia
-
 Turkey
-
 UAE
-
 Uganda
-
 Ukraine
-
 United Kingdom
-
United States
-
 Uruguay
-
 Uzbekistan
-
 Venezuela
-
 Vietnam
-
 Yemen
-
 Zambia
-
 Zimbabwe
- Forex
- Crypto












