

What's behind Jito's latest 9.5% price pullback?

Jito (JTO) plunged 9.5% today as strong technical selling pressure drove the asset lower. The move is supported by JTO trading well below all key moving averages, with multiple bearish signals reinforcing persistent downside risk.
 0.2257
0.2756
Highlights
- JTO/USD trades below major moving averages, confirming strong downward pressure across all timeframes.
- Momentum indicators remain deeply oversold, though oscillators suggest potential for a short-term rebound from current levels.
- Next five days expected range is $0.1714 to $0.2474, with high probability of continued downside unless price breaks above $0.2209.
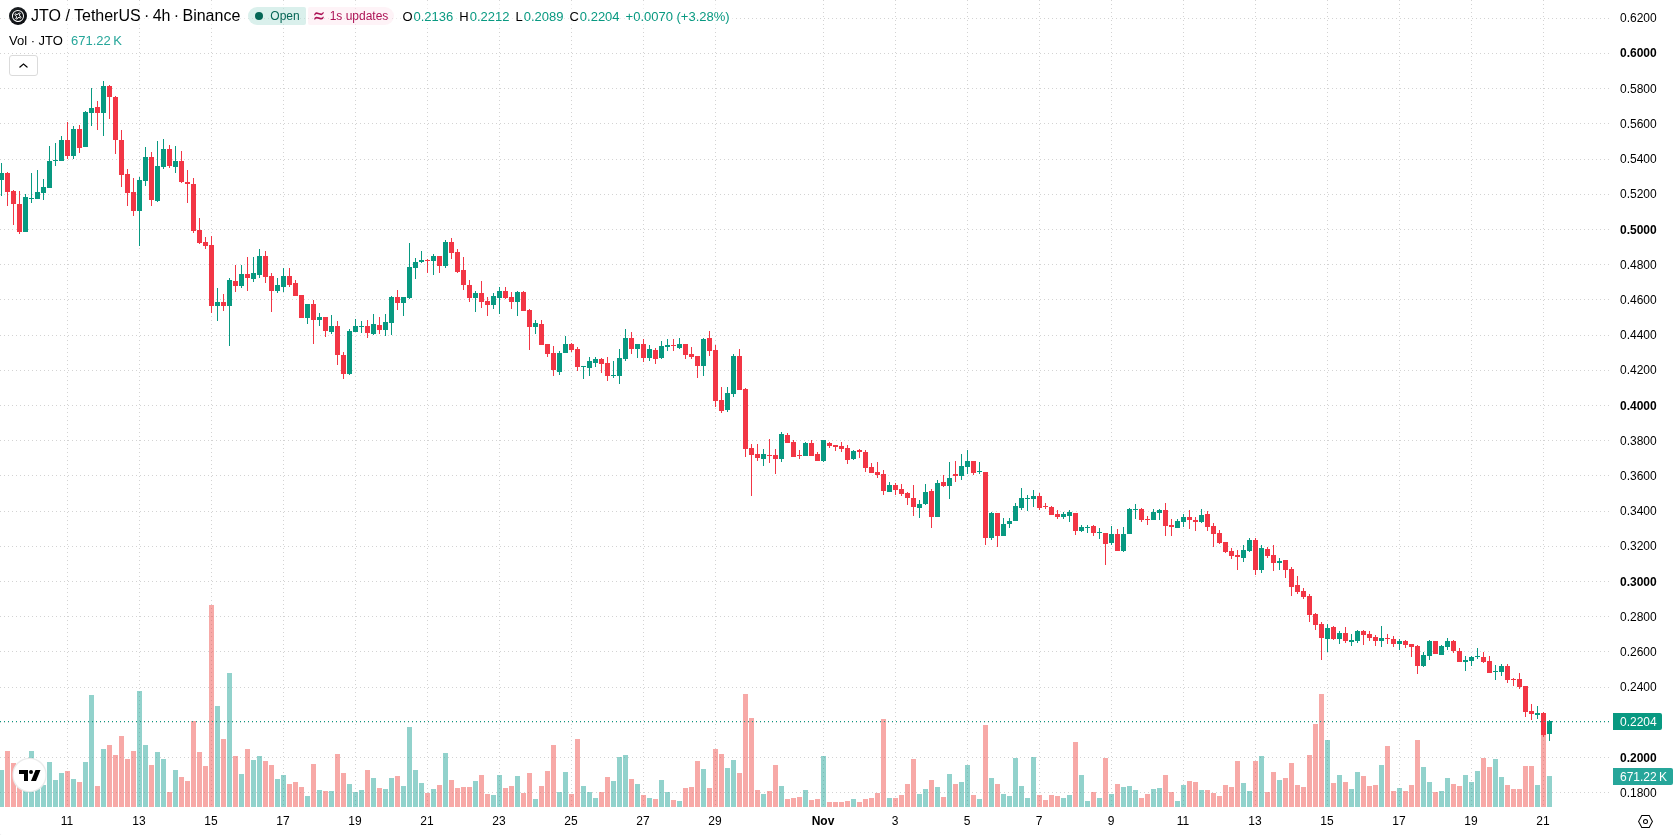
Oversold signals emerge as persistent bearish momentum dominates
JTO/USD is trading below the MA-20 ($0.3104), MA-50 ($0.4131), and MA-200 ($0.5218), confirming consistent downward momentum across all timeframes. The near-term resistance stands at $0.2209, with immediate support seen at $0.2089. The alignment of the MA-50 beneath the MA-200 highlights a negative long-term setup. Short-term momentum indicators—including RSI, CCI, and the Stochastic RSI—all register in the oversold zone, indicating severe selling exhaustion and a potential for technical rebound risk. However, the MACD and ADX continue to suggest persistent selling momentum, and BBP confirms that sellers are in control. The sizeable daily drop and ongoing high intraday volatility indicate continued downside pressure following a gap lower at the open.
Earlier, analysts noted that Jito (JTO) was under persistent bearish pressure, with technical weakness and declining platform revenue keeping expectations of further downside elevated. The current analysis reinforces this negative outlook with new evidence of strong technical selling, highlighting risk of further losses should JTO break below immediate support at $0.2089.











-
 Afghanistan
-
 Albania
-
 Algeria
-
 Angola
-
 Argentina
-
 Armenia
-
 Australia
-
 Austria
-
 Azerbaijan
-
 Bahamas
-
 Bahrain
-
 Bangladesh
-
 Belarus
-
 Belgium
-
 Bolivia
-
 Botswana
-
 Brazil
-
 Brunei
-
 Bulgaria
-
 Cambodia
-
 Cameroon
-
 Canada
-
 Chile
-
 China
-
 Colombia
-
 Congo
-
 Costa Rica
-
 Cote d'Ivoire
-
 Croatia
-
 Cuba
-
 Cyprus
-
 Czechia
-
 DR Congo
-
 Denmark
-
 Dominican Republic
-
 Ecuador
-
 Egypt
-
 El Salvador
-
 Estonia
-
 Eswatini
-
 Ethiopia
-
 Finland
-
 France
-
 Georgia
-
 Germany
-
 Ghana
-
 Greece
-
 Haiti
-
 Hong Kong
-
 Hungary
-
 India
-
 Indonesia
-
 Iran, Islamic republic
-
 Iraq
-
 Ireland
-
 Israel
-
 Italy
-
 Jamaica
-
 Japan
-
 Jordan
-
 Kazakhstan
-
 Kenya
-
 Korea
-
 Kuwait
-
 Kyrgyzstan
-
 Laos
-
 Latvia
-
 Lebanon
-
 Lesotho
-
 Libya
-
 Lithuania
-
 Luxembourg
-
 Madagascar
-
 Malaysia
-
 Malta
-
 Mauritius
-
 Mexico
-
 Moldova
-
 Mongolia
-
 Montenegro
-
 Morocco
-
 Mozambique
-
 Myanmar
-
 Namibia
-
 Nepal
-
 Netherlands
-
 New Zealand
-
 Nigeria
-
 North Macedonia
-
 Norway
-
 Oman
-
 Pakistan
-
 Palestine
-
 Panama
-
 Papua New Guinea
-
 Paraguay
-
 Peru
-
 Philippines
-
 Poland
-
 Portugal
-
 Puerto Rico
-
 Qatar
-
 Reunion
-
 Romania
-
 Rwanda
-
 Saudi Arabia
-
 Serbia
-
 Singapore
-
 Slovakia
-
 Slovenia
-
 Somalia
-
 South Africa
-
 Spain
-
 Sri Lanka
-
 Sweden
-
 Switzerland
-
 Syria
-
 Taiwan
-
 Tajikistan
-
 Tanzania
-
 Thailand
-
 Trinidad and Tobago
-
 Tunisia
-
 Turkey
-
 UAE
-
 Uganda
-
 Ukraine
-
 United Kingdom
-
United States
-
 Uruguay
-
 Uzbekistan
-
 Venezuela
-
 Vietnam
-
 Yemen
-
 Zambia
-
 Zimbabwe
- Forex
- Crypto












