

Solana steadies near $136 as traders assess trendline break and rising derivatives activity

Solana is attempting to stabilize near $136 after a steep multiweek decline that broke the long-term ascending trendline for the first time since early 2025. The latest rebound comes as the market absorbs persistent spot outflows, cooling liquidity conditions and a cautious derivatives market that is beginning to show its first signs of risk re-engagement.
Highlights
- Solana holds near $136 after breaking its long-term trendline for the first time this year.
- Spot outflows remain heavy, with more than $30 million exiting the market on November 25.
- Derivatives positioning improves as open interest rises and traders cautiously rebuild exposure.
While SOL remains under pressure after losing nearly a quarter of its value from the $180 region, the charts and flow data indicate early stabilization that traders will be watching closely this week.
Technical pressure builds as Solana tests support
The daily chart shows a clean breakdown from the rising trendline that supported Solana for almost nine months. That structure had defined every major rebound through 2025, and its failure triggered a decisive momentum shift. Price dropped sharply from the $180 area into the low $130s, where buyers stepped in to halt the decline.
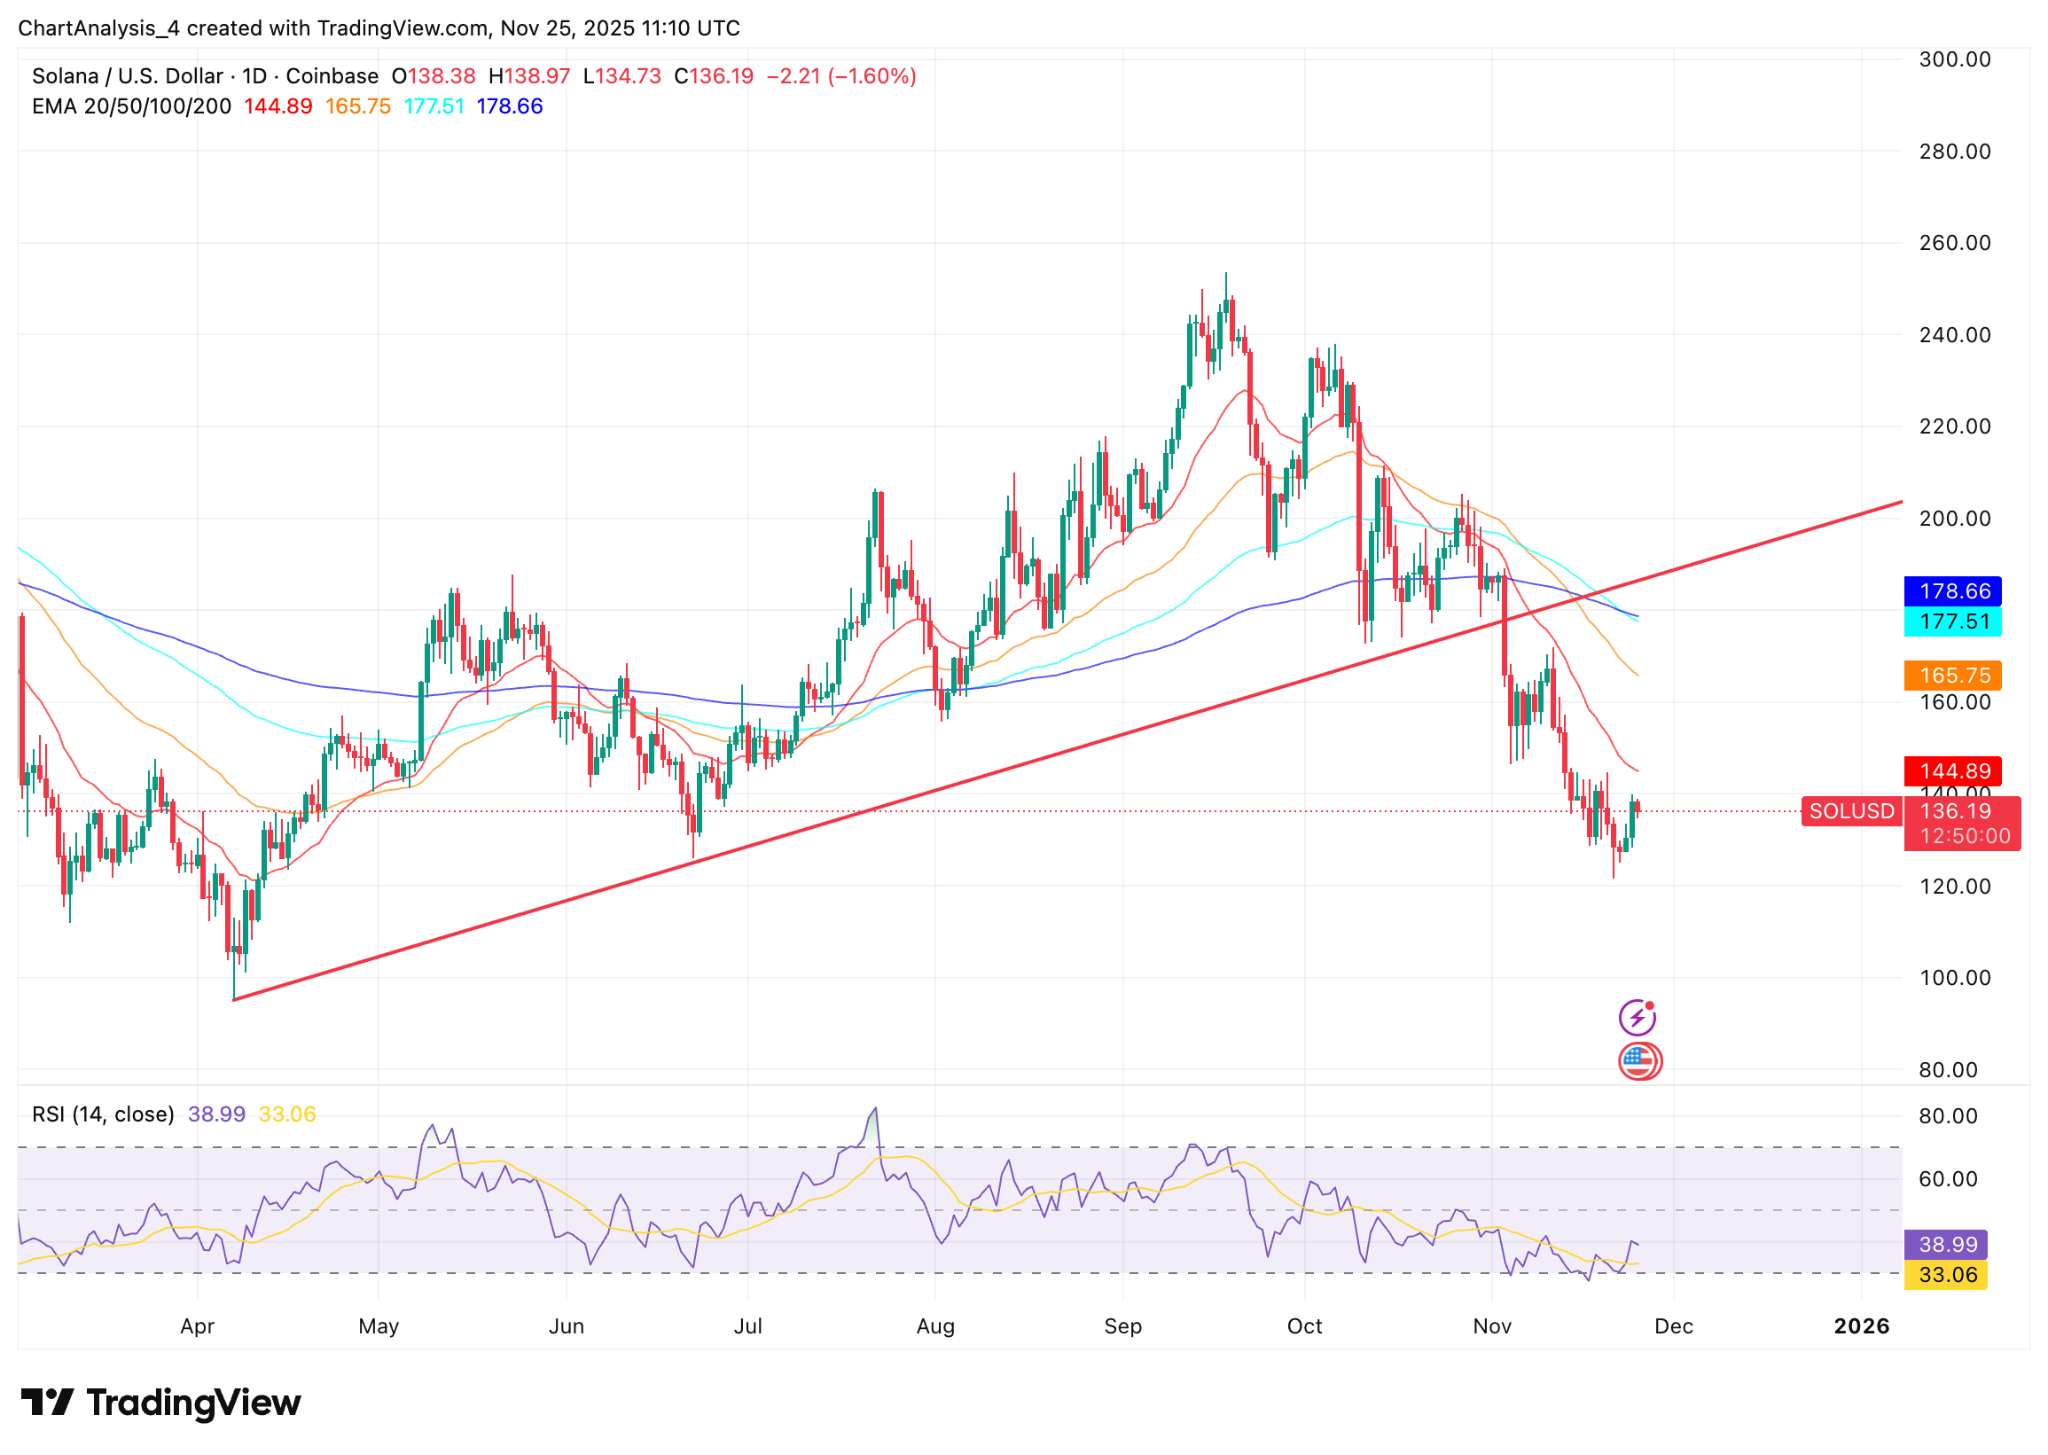
SOL price dynamics (Source: TradingView)
The 20-day EMA at $144 has been the first barrier, and SOL has failed to close above it throughout November. A decisive reclaim of this level would signal that buyers are beginning to regain control. The 50-day and 100-day EMAs at $165 and $177 sit far overhead and reflect how much momentum has been lost since the trendline break.
Momentum indicators show mild improvement. RSI bounced from 33 to just under 40, reflecting easing selling pressure but no strong bullish confirmation. Historically, Solana produces more lasting recoveries only after RSI clears the mid-40 region with conviction.
Support remains concentrated near $130. A loss of that floor would expose the $118 to $120 zone, which marks the July breakout origin and a high-volume liquidity pocket. If the latest rebound weakens, this area becomes the next critical test for buyers.
Flows show distribution easing, but spot outflows continue
Spot flows reinforce the cautious tone. Coinglass data shows another $30.87 million in net outflows on November 25, extending a multiweek stretch of steady distribution. Large holders continue trimming exposure, and the absence of sustained inflow spikes indicates that institutions are not yet stepping in to accumulate.
Derivatives activity, however, is beginning to turn. Open interest rose 2.31 percent to $7.06 billion, signaling renewed participation after last week’s washout. Trading volume is up nearly 9 percent, and options activity has climbed 14 percent as volatility strategies re-enter the market. Long-short ratios show a slight bullish tilt, with Binance at 3.46 and OKX at 2.74.
The most notable signal is the divergence between rising open interest and depressed price. When it appears after forced liquidations, this pattern often marks the early stage of accumulation. But without corresponding spot inflows, it also raises the risk of another long-liquidation cascade if a sharp move lower occurs.
Outlook: Can Solana recover above the 20-day EMA
Solana enters the week in a defined consolidation after a decisive structural break. The technical roadmap is straightforward. A close above the 20-day EMA at $144 would open the door toward $160 and then the $175 region, where the next major resistance cluster sits. Failure to reclaim short-term averages would leave the rebound vulnerable and expose a retest of the $130 floor.
With liquidity conditions still weak and spot flows negative, recovery attempts depend on whether derivatives momentum can translate into real buying. Traders will watch if the rising open interest marks accumulation or a slow build-up of risk ahead of another volatility event.
In earlier discussions, we noted that Solana’s trendline integrity was the backbone of its multi-month rally and that a clean break would bring a deeper corrective phase. That scenario has now unfolded, and the current stabilization reflects the early rebuilding phase we flagged once the trendline failed.










-
 Afghanistan
-
 Albania
-
 Algeria
-
 Angola
-
 Argentina
-
 Armenia
-
 Australia
-
 Austria
-
 Azerbaijan
-
 Bahamas
-
 Bahrain
-
 Bangladesh
-
 Belarus
-
 Belgium
-
 Bolivia
-
 Botswana
-
 Brazil
-
 Brunei
-
 Bulgaria
-
 Cambodia
-
 Cameroon
-
 Canada
-
 Chile
-
 China
-
 Colombia
-
 Congo
-
 Costa Rica
-
 Cote d'Ivoire
-
 Croatia
-
 Cuba
-
 Cyprus
-
 Czechia
-
 DR Congo
-
 Denmark
-
 Dominican Republic
-
 Ecuador
-
 Egypt
-
 El Salvador
-
 Estonia
-
 Eswatini
-
 Ethiopia
-
 Finland
-
 France
-
 Georgia
-
 Germany
-
 Ghana
-
 Greece
-
 Haiti
-
 Hong Kong
-
 Hungary
-
 India
-
 Indonesia
-
 Iran, Islamic republic
-
 Iraq
-
 Ireland
-
 Israel
-
 Italy
-
 Jamaica
-
 Japan
-
 Jordan
-
 Kazakhstan
-
 Kenya
-
 Korea
-
 Kuwait
-
 Kyrgyzstan
-
 Laos
-
 Latvia
-
 Lebanon
-
 Lesotho
-
 Libya
-
 Lithuania
-
 Luxembourg
-
 Madagascar
-
 Malaysia
-
 Malta
-
 Mauritius
-
 Mexico
-
 Moldova
-
 Mongolia
-
 Montenegro
-
 Morocco
-
 Mozambique
-
 Myanmar
-
 Namibia
-
 Nepal
-
 Netherlands
-
 New Zealand
-
 Nigeria
-
 North Macedonia
-
 Norway
-
 Oman
-
 Pakistan
-
 Palestine
-
 Panama
-
 Papua New Guinea
-
 Paraguay
-
 Peru
-
 Philippines
-
 Poland
-
 Portugal
-
 Puerto Rico
-
 Qatar
-
 Reunion
-
 Romania
-
 Rwanda
-
 Saudi Arabia
-
 Serbia
-
 Singapore
-
 Slovakia
-
 Slovenia
-
 Somalia
-
 South Africa
-
 Spain
-
 Sri Lanka
-
 Sweden
-
 Switzerland
-
 Syria
-
 Taiwan
-
 Tajikistan
-
 Tanzania
-
 Thailand
-
 Trinidad and Tobago
-
 Tunisia
-
 Turkey
-
 UAE
-
 Uganda
-
 Ukraine
-
 United Kingdom
-
United States
-
 Uruguay
-
 Uzbekistan
-
 Venezuela
-
 Vietnam
-
 Yemen
-
 Zambia
-
 Zimbabwe
- Forex
- Crypto












