
Sell in May 2026? Three risks that make the old adage worth hearing

The S&P 500 closed at a record 7,041 on April 17, 2026 — just weeks after plunging roughly 10% on Iran-war fears. The index has surged about 11% since its late-March low, a gain most investors would happily accept over an entire year. Yet the rally lands right on the doorstep of the oldest seasonal warning in finance: "Sell in May and go away."
Since 1950, the S&P 500 has averaged 7.2% from November through April versus just 2.1% from May through October. The pattern is real, but it is also thin. May–October returns are still positive more often than not. This year, however, three specific risks give the adage more bite than usual: an oil shock that has not fully resolved, equity valuations and margin debt near historical extremes, and an unprecedented Federal Reserve leadership transition in the middle of a supply-side inflation scare. Taken together, they argue not for panic selling, but for deliberate risk reduction heading into summer.
Oil shock and recession risk: History’s clearest warning
Since World War II, nearly every major oil price shock has preceded or triggered a U.S. recession. The 1973 OPEC embargo, the 1979 Iranian Revolution, the 1990 Gulf War, and the 2008 commodity super cycle all followed the same playbook: surging crude prices squeezed consumer spending, pushed up input costs, and forced the Fed into tighter policy — a combination that eventually tipped the economy into contraction.
The current Iran–Hormuz crisis fits the template. Brent crude spiked roughly 50% during the initial phase of the conflict, according to the March FOMC minutes. While prices have eased from their peaks following the recent ceasefire, they remain elevated above USD 100 per barrel. The disruption to Strait of Hormuz flows, which carried about 20mn barrels per day before the war, has triggered a coordinated 400mn barrel emergency stockpile release, government-mandated fuel rationing across Asia, and fuel surcharges from companies.
The risk for equities is straightforward: sustained oil above USD 100 feeds directly into headline inflation, which in turn removes the Fed’s ability to cut rates. Goldman Sachs’s bear-case scenario, where oil remains above USD 110 and forces the Fed to pause or reverse its easing path, projects the S&P 500 falling to 5,400, roughly 23% below current levels. Even if the full bear case does not materialize, the inflation impulse from elevated energy costs narrows the margin for policy error and raises the odds of a negative growth surprise in Q3–Q4 2026.
Figure 1. Major oil shocks and subsequent U.S. recessions since 1973

Stretched valuations and record margin debt leave little room for error
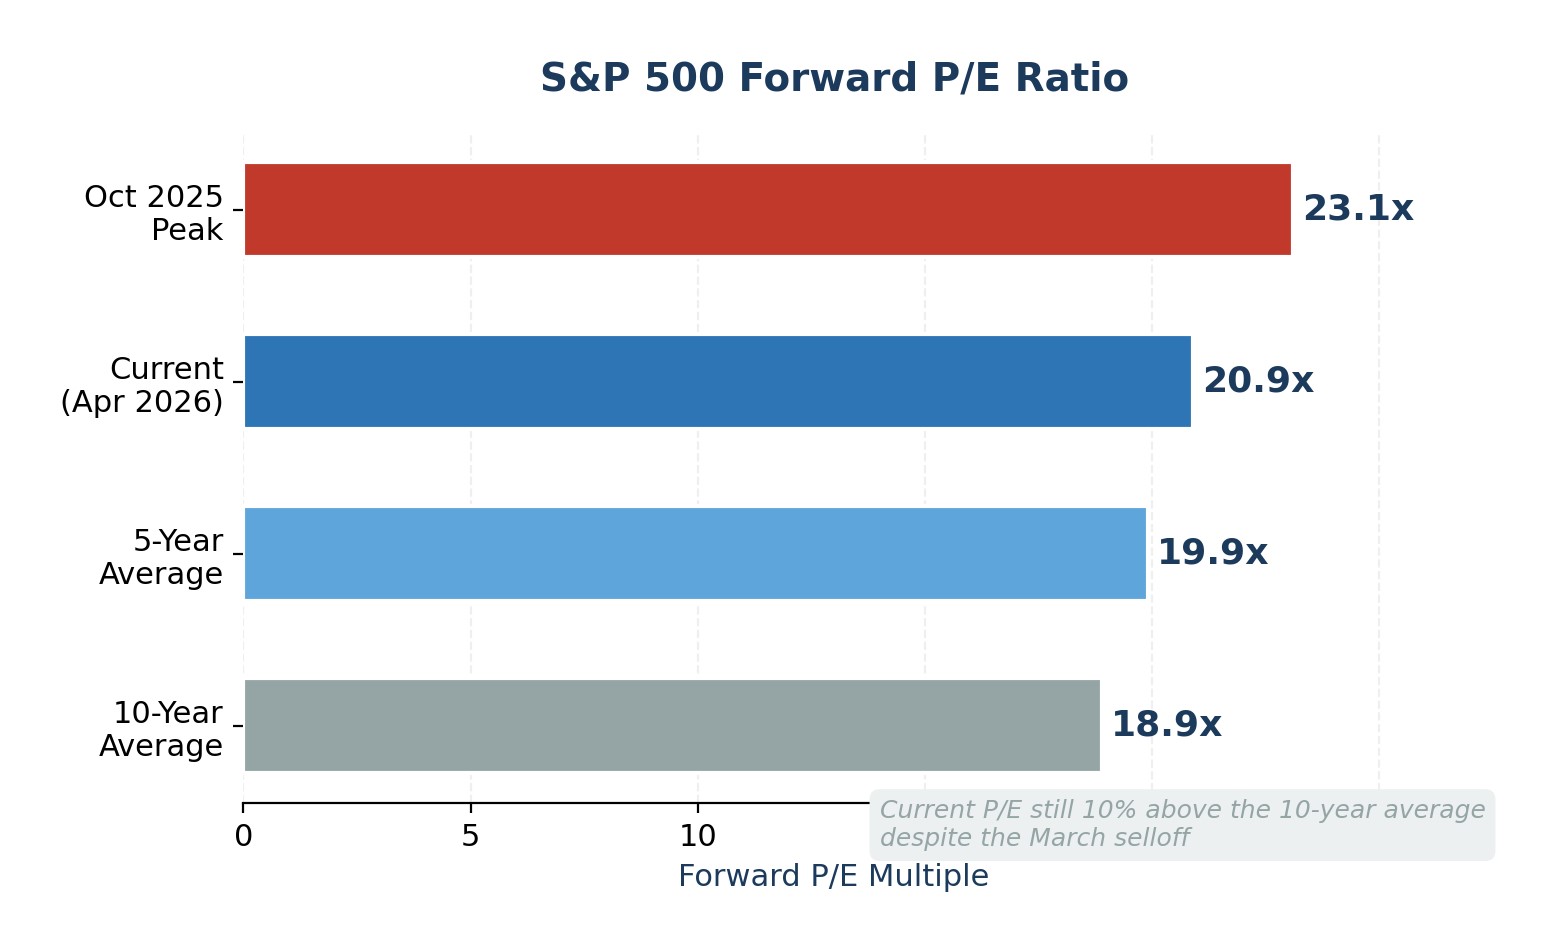
The April rally brought the S&P 500 back to record highs, but it did not reset the valuation problem. The forward P/E ratio currently sits at 20.9x, above both the 5-year average and the 10-year average of 19.9x and 18.9x, respectively. The trailing P/E of 27.8x is even more stretched, sitting well above the 10-year average of 23.2x. These multiples imply that investors are pricing in strong earnings growth continuing without interruption, an assumption that leaves no cushion for disappointment.
Making matters more fragile, index concentration has reached extremes. Goldman Sachs notes that the top 10 stocks now account for 39% of S&P 500 market capitalization and 31% of index earnings. When a handful of mega-cap names drive both price and profit, a single earnings miss from a name like NVIDIA or Microsoft can ripple through the entire index.
At the same time, margin debt remains near record highs. FINRA data through March 2026 shows investors have borrowed over USD 1.2 trillion against their portfolios to buy stocks. Elevated margin debt is not a timing signal on its own, but it amplifies drawdowns: forced liquidation accelerates selling during corrections, turning orderly pullbacks into cascading declines. The combination of high valuations, extreme concentration, and leveraged positioning is the textbook definition of a market with fragile upside and asymmetric downside.
Figure 2. S&P 500 Forward P/E: Current level vs. Historical averages
Seasonal weakness meets a Fed chair transition
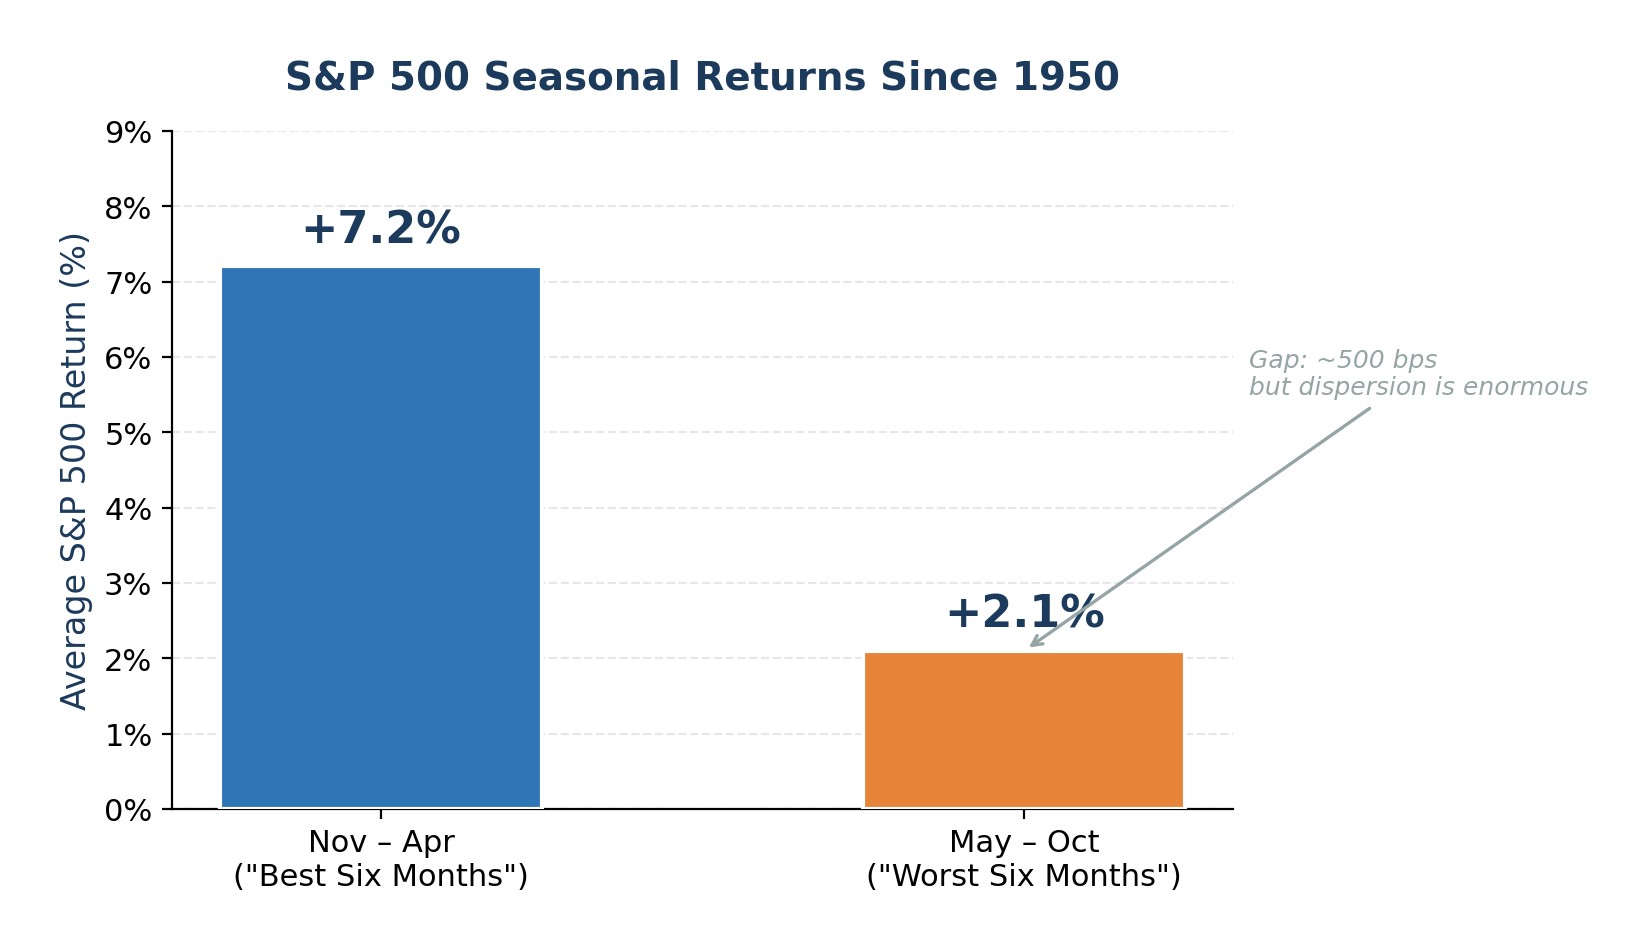
The “Sell in May” pattern has a real but modest statistical foundation. Since 1950, the S&P 500 has returned about 500 basis points more during the November–April window than during May–October. The gap is meaningful over decades, but the dispersion is enormous: May–October returns were positive in about 65% of years, and in recent years several summer months have ranked among the index’s best.
What makes 2026 different is the overlay of a midterm election year and a Fed leadership change. Historically, midterm election years see average peak-to-trough corrections of roughly 17.5%. The recent 10% Iran-driven selloff may not have fully satisfied that pattern. More importantly, Jerome Powell’s term as Fed chair expires in mid-May 2026, with Kevin Warsh nominated but stalled in the Senate. Powell has indicated he will remain until a successor is confirmed, but the uncertainty around the transition is real. Markets have a documented history of “testing” new Fed chairs, e.g., Powell himself saw the S&P 500 drop nearly 20% in late 2018 after hawkish comments, and Alan Greenspan faced the 1987 crash shortly after taking the helm.
A Warsh-led Fed is widely expected to be more hawkish on inflation but less accommodative toward labor-market weakness. That shift in the reaction function arrives at exactly the wrong time: the oil shock demands monetary flexibility, and the economy may be quietly softening beneath the surface. Futures markets now price a 77% probability that the Fed holds rates at 3.5–3.75% through December 2026, with J.P. Morgan’s base case calling for no cuts at all this year.
Figure 3. S&P 500 average seasonal returns: Nov–Apr vs. May–Oct (Since 1950)
Where Wall Street stands: 2026 year-end S&P 500 targets
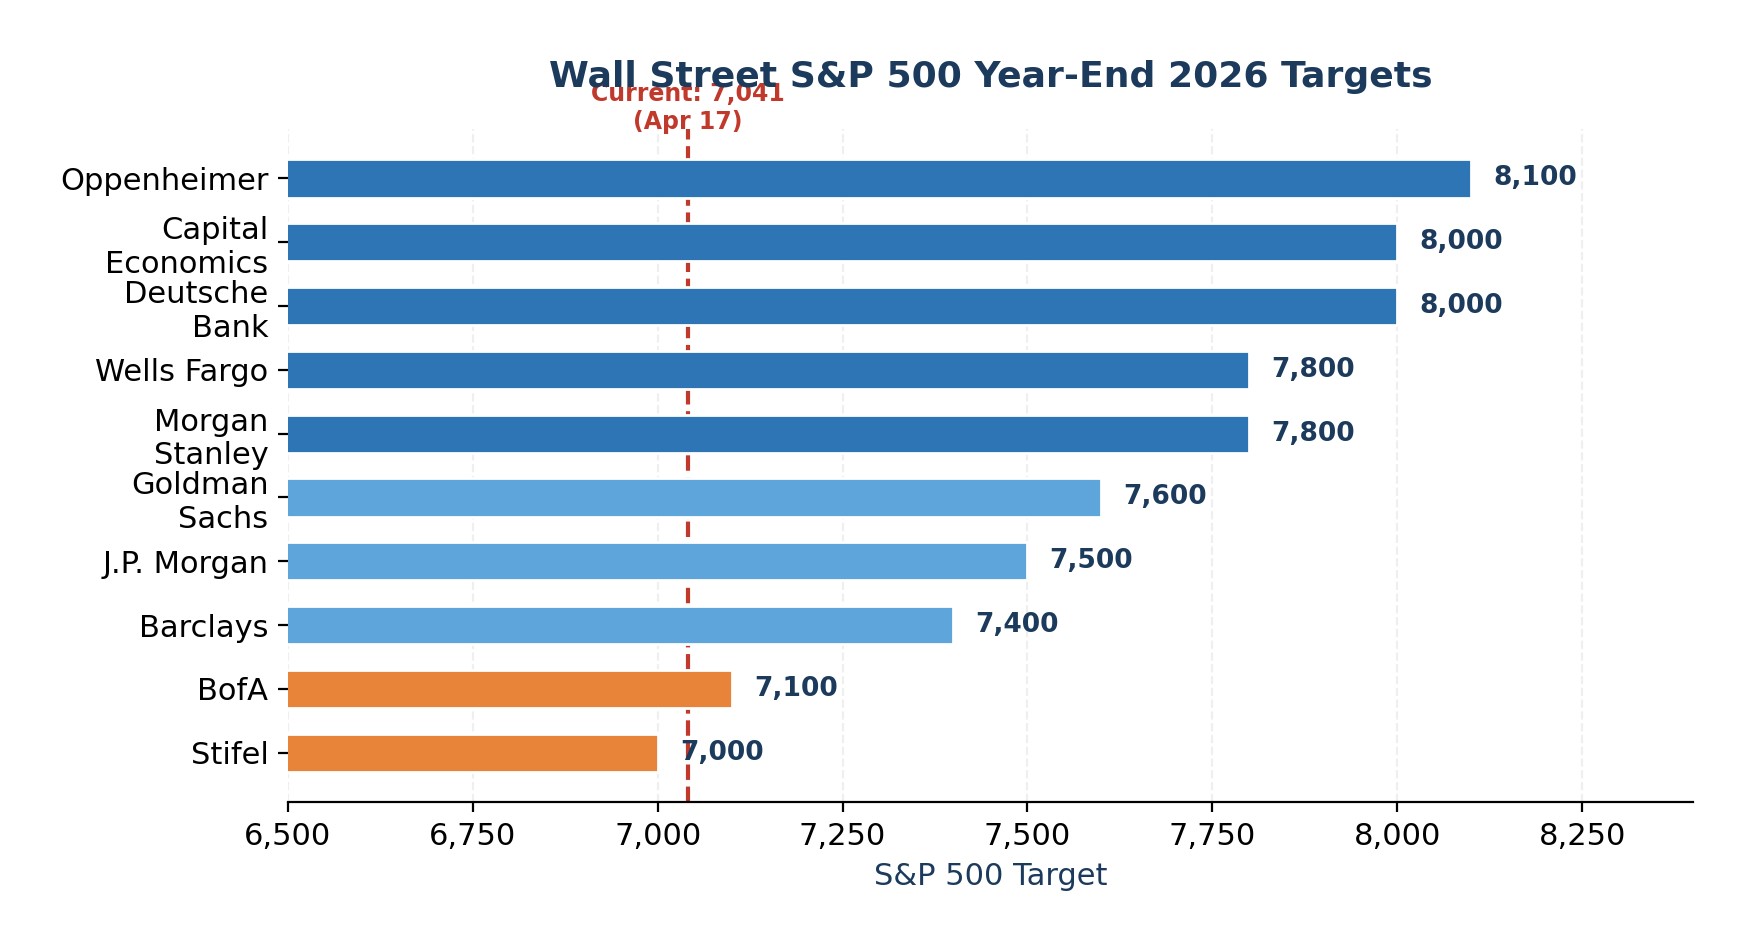
Despite these risks, sell-side year-end targets cluster in the 7,000–8,100 range, implying 0–15% upside from current levels. The consensus median of roughly 7,635 suggests Wall Street expects an orderly resolution. But it is worth noting that no major firm is calling for a negative year.
Figure 4. Wall Street S&P 500 Year-End 2026 Targets by Firm
Expert opinion
I am not calling for a crash, but the risk-reward appears tilted to the downside for the May–October period. Three risks converge as seasonal patterns turn less favorable: an unresolved oil shock that has removed the Fed’s rate-cut option, valuations and leverage near cycle highs, and a potentially contested Fed chair transition in May. This is not a reason to liquidate, but it is a clear signal to rebalance.
Specifically, I would reduce overweight exposure to mega-cap tech by shifting some allocation toward equal-weight S&P 500 strategies, which capture the broadening earnings recovery without the concentration risk. I would also rebuild a cash buffer of at least 10–15% of portfolio value to act opportunistically if a September–October dip materializes.
For futures, I would favor a measured long in gold futures and only selective exposure to crude oil futures on pullbacks, because both can benefit if geopolitical stress and inflation hedging stay elevated.
For investors comfortable with options, buying protective puts or collar structures on SPY while the VIX is compressed offers asymmetric downside protection at reasonable premiums. In currencies, I would lean toward the U.S. dollar and Swiss franc over high-beta and growth-sensitive currencies. The goal is not to time the top, it is to own the portfolio you actually want to own when volatility returns.


Latest Finance News


-
 Afghanistan
-
 Albania
-
 Algeria
-
 Angola
-
 Argentina
-
 Armenia
-
 Australia
-
 Austria
-
 Azerbaijan
-
 Bahamas
-
 Bahrain
-
 Bangladesh
-
 Belarus
-
 Belgium
-
 Bolivia
-
 Botswana
-
 Brazil
-
 Brunei
-
 Bulgaria
-
 Cambodia
-
 Cameroon
-
 Canada
-
 Chile
Chile
-
 China
China
-
 Colombia
-
 Congo
Congo
-
 Costa Rica
-
 Cote d'Ivoire
-
 Croatia
-
 Cuba
Cuba
-
 Cyprus
-
 Czechia
-
 DR Congo
-
 Denmark
-
 Dominican Republic
-
 Ecuador
-
 Egypt
Egypt
-
 El Salvador
-
 Estonia
-
 Eswatini
-
 Ethiopia
-
 Finland
-
 France
-
 Georgia
-
 Germany
-
 Ghana
Ghana
-
 Greece
-
 Haiti
Haiti
-
 Hong Kong
-
 Hungary
-
 India
India
-
 Indonesia
-
 Iran, Islamic republic
-
 Iraq
Iraq
-
 Ireland
-
 Israel
-
 Italy
Italy
-
 Jamaica
-
 Japan
Japan
-
 Jordan
-
 Kazakhstan
-
 Kenya
Kenya
-
 Korea
Korea
-
 Kuwait
-
 Kyrgyzstan
-
 Laos
Laos
-
 Latvia
-
 Lebanon
-
 Lesotho
-
 Libya
Libya
-
 Lithuania
-
 Luxembourg
-
 Madagascar
-
 Malaysia
-
 Malta
Malta
-
 Mauritius
-
 Mexico
-
 Moldova
-
 Mongolia
-
 Montenegro
-
 Morocco
-
 Mozambique
-
 Myanmar
-
 Namibia
-
 Nepal
Nepal
-
 Netherlands
-
 New Zealand
-
 Nigeria
-
 North Macedonia
-
 Norway
-
 Oman
Oman
-
 Pakistan
-
 Palestine
-
 Panama
-
 Papua New Guinea
-
 Paraguay
-
 Peru
Peru
-
 Philippines
-
 Poland
-
 Portugal
-
 Puerto Rico
-
 Qatar
Qatar
-
 Reunion
-
 Romania
-
 Rwanda
-
 Saudi Arabia
-
 Serbia
-
 Singapore
-
 Slovakia
-
 Slovenia
-
 Somalia
-
 South Africa
-
 Spain
Spain
-
 Sri Lanka
-
 Sweden
-
 Switzerland
-
 Syria
Syria
-
 Taiwan
-
 Tajikistan
-
 Tanzania
-
 Thailand
-
 Trinidad and Tobago
-
 Tunisia
-
 Turkey
-
 UAE
UAE
-
 Uganda
-
 Ukraine
-
 United Kingdom
-
United States
-
 Uruguay
-
 Uzbekistan
-
 Venezuela
-
 Vietnam
-
 Yemen
Yemen
-
 Zambia
-
 Zimbabwe
- Forex
- Crypto
