
Nasdaq Composite drops 1.2% after Trump–Powell report spooks rate policy outlook

Nasdaq Composite futures fell sharply in Monday’s premarket session, dropping over 1.2%, or 320 points, as political tensions weighed on investor sentiment. The trigger was a controversial report that the Trump administration had threatened to indict Fed Chair Jerome Powell over his prior testimony regarding a building renovation project. Powell described the threat as a pretext to interfere in the Fed’s independence. Markets interpreted the development as a threat to interest rate policy stability, prompting a selloff in the dollar and tech-heavy futures.
Highlights
- Nasdaq drops over 1.2% after report suggests Trump threatened Fed Chair Powell
- Repeated failure at 23,700 keeps Nasdaq inside ascending triangle consolidation since November
- Inflation data now key as index holds 23,400 support near 4h 50 EMA
That fundamental shock coincides technically with another rejection from the 23,700 resistance level. Since November 2025, the Nasdaq Composite has made several bullish attempts to pierce through that supply zone. Each attempt has failed, keeping price action trapped in a narrowing ascending triangle. The repeated rejection suggests that sellers are defending the area aggressively, and traders are reluctant to initiate fresh longs until there is a confirmed breakout.
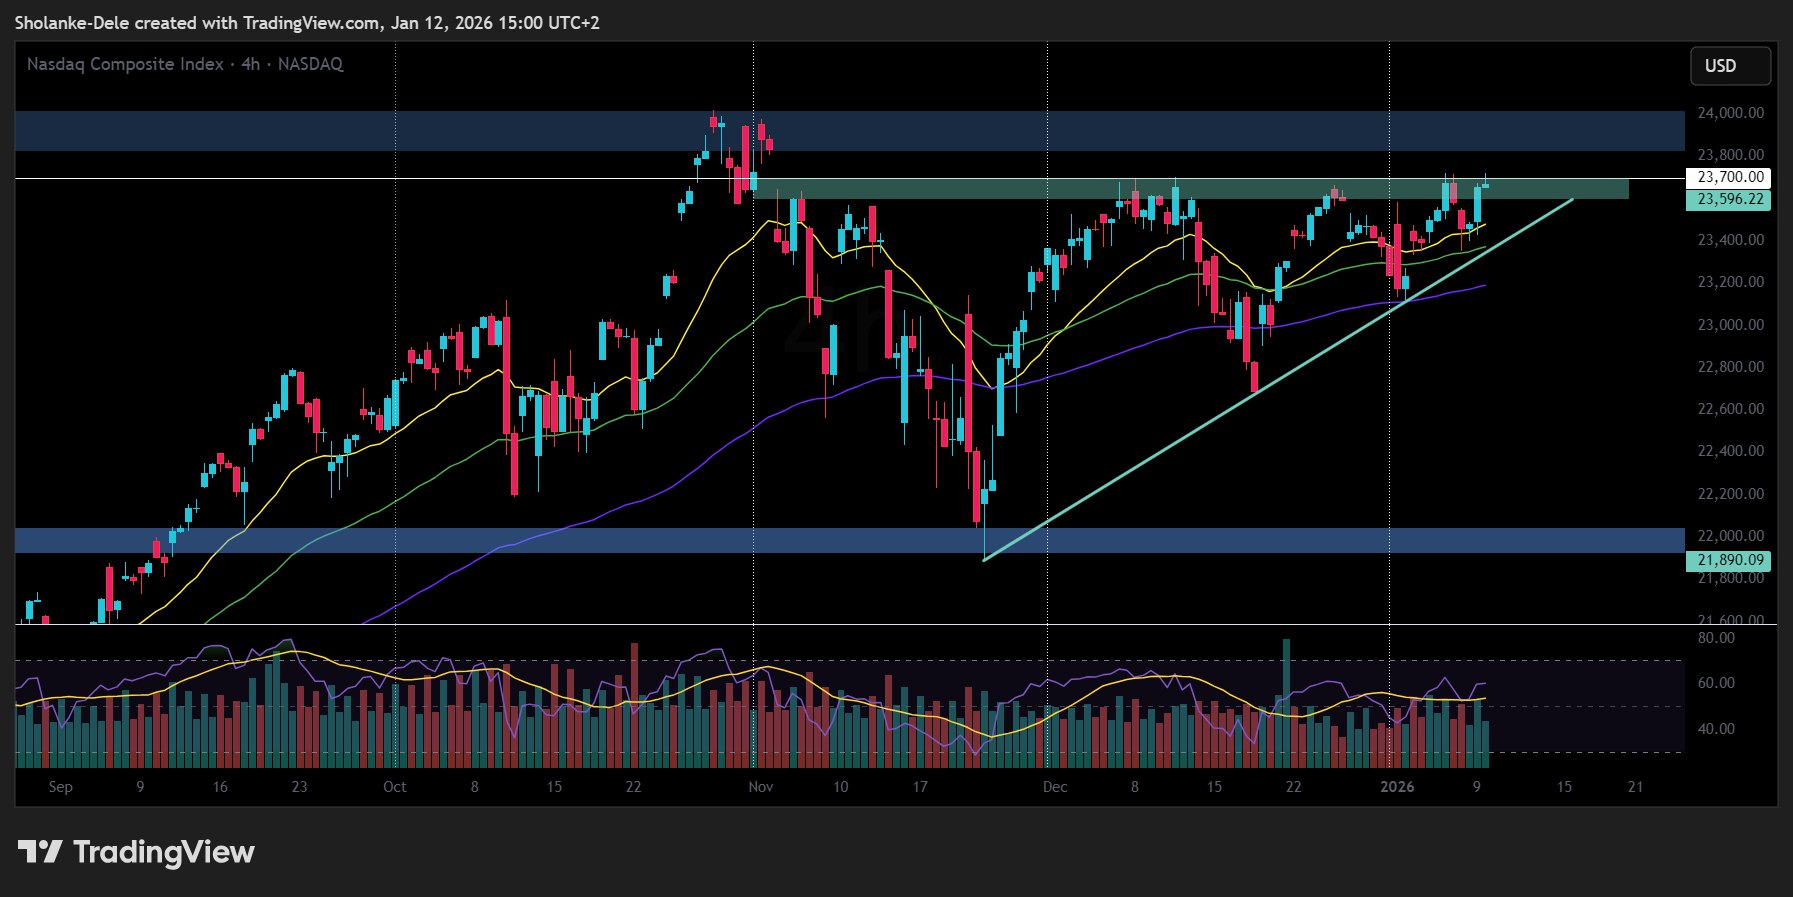
Nasdaq Composite price chart (Oct 2025 - Jan 2026). Source: Tradingview
Despite the failure to break through 23,700, the underlying price structure remains constructive. The rising triangle pattern continues to compress price into a tighter range. Friday’s attempt was notable because it came during the volatile aftermath of December’s U.S. jobs data. Nonfarm Payrolls increased by 50,000, falling short of the 60,000 consensus, while unemployment dropped to 4.4% from 4.6%. Those figures slightly cooled expectations for an aggressive Fed rate cut cycle in early 2026.
Friday’s failed breakout follows weaker jobs print and cooler Fed rate expectations
The jobs print also coincided with the S&P 500 and Dow Jones printing new all-time highs. Yet the Nasdaq failed to clear the 23,700 barrier even as its peers surged. The inability to participate in that broader bullish breakout further highlights the importance of the triangle consolidation structure on Nasdaq’s chart. Both bulls and bears are now leaning heavily on their respective levels.
50 EMA aligns near trendline support as bulls defend the key zone
Price is now sitting above the ascending trendline support near 23,400, which is also reinforced by the 50 EMA on the 4-hour chart. This area has served as a launching pad for prior intraday rebounds over the last two weeks. Investors may now hesitate to take aggressive bets ahead of Tuesday’s inflation release, allowing the index to consolidate further within the triangle.
If inflation data shows a softer reading, the Nasdaq could stage another test of the 23,700 barrier. A breakout above that level would open the door for a new leg higher towards the 24,000 to 24,200 zone. However, failure to hold the 23,400 trendline support could see the index slide towards 23,100 short-term, where buyers may re-emerge.
In recent analysis, we discussed how the Nasdaq Composite stalled below 23,480 after reversing from 23,700 resistance. A tech-led selloff dragged the index to a three-day low before support held near 23,350.


Latest Nasdaq Composite News


-
 Afghanistan
-
 Albania
-
 Algeria
-
 Angola
-
 Argentina
-
 Armenia
-
 Australia
-
 Austria
-
 Azerbaijan
-
 Bahamas
-
 Bahrain
-
 Bangladesh
-
 Belarus
-
 Belgium
-
 Bolivia
-
 Botswana
-
 Brazil
-
 Brunei
-
 Bulgaria
-
 Cambodia
-
 Cameroon
-
 Canada
-
 Chile
Chile
-
 China
China
-
 Colombia
-
 Congo
Congo
-
 Costa Rica
-
 Cote d'Ivoire
-
 Croatia
-
 Cuba
Cuba
-
 Cyprus
-
 Czechia
-
 DR Congo
-
 Denmark
-
 Dominican Republic
-
 Ecuador
-
 Egypt
Egypt
-
 El Salvador
-
 Estonia
-
 Eswatini
-
 Ethiopia
-
 Finland
-
 France
-
 Georgia
-
 Germany
-
 Ghana
Ghana
-
 Greece
-
 Haiti
Haiti
-
 Hong Kong
-
 Hungary
-
 India
India
-
 Indonesia
-
 Iran, Islamic republic
-
 Iraq
Iraq
-
 Ireland
-
 Israel
-
 Italy
Italy
-
 Jamaica
-
 Japan
Japan
-
 Jordan
-
 Kazakhstan
-
 Kenya
Kenya
-
 Korea
Korea
-
 Kuwait
-
 Kyrgyzstan
-
 Laos
Laos
-
 Latvia
-
 Lebanon
-
 Lesotho
-
 Libya
Libya
-
 Lithuania
-
 Luxembourg
-
 Madagascar
-
 Malaysia
-
 Malta
Malta
-
 Mauritius
-
 Mexico
-
 Moldova
-
 Mongolia
-
 Montenegro
-
 Morocco
-
 Mozambique
-
 Myanmar
-
 Namibia
-
 Nepal
Nepal
-
 Netherlands
-
 New Zealand
-
 Nigeria
-
 North Macedonia
-
 Norway
-
 Oman
Oman
-
 Pakistan
-
 Palestine
-
 Panama
-
 Papua New Guinea
-
 Paraguay
-
 Peru
Peru
-
 Philippines
-
 Poland
-
 Portugal
-
 Puerto Rico
-
 Qatar
Qatar
-
 Reunion
-
 Romania
-
 Rwanda
-
 Saudi Arabia
-
 Serbia
-
 Singapore
-
 Slovakia
-
 Slovenia
-
 Somalia
-
 South Africa
-
 Spain
Spain
-
 Sri Lanka
-
 Sweden
-
 Switzerland
-
 Syria
Syria
-
 Taiwan
-
 Tajikistan
-
 Tanzania
-
 Thailand
-
 Trinidad and Tobago
-
 Tunisia
-
 Turkey
-
 UAE
UAE
-
 Uganda
-
 Ukraine
-
 United Kingdom
-
United States
-
 Uruguay
-
 Uzbekistan
-
 Venezuela
-
 Vietnam
-
 Yemen
Yemen
-
 Zambia
-
 Zimbabwe
- Forex
- Crypto
