
+4.14% for Tesla stock — bullish momentum continues despite margin challenges

Tesla, Inc. (TSLA) is trading at $449.32, positioned above the MA-20 ($447.82), MA-50 ($442.29), and MA-200 ($371.66), confirming bullish momentum across short, medium, and long-term trends. The Ichimoku Kijun at $458.14 serves as the next dynamic resistance, while the MA-50 acts as a nearby support.
 399.23
413.06
399.23
413.06
Highlights
- Tesla (TSLA) trades at $449.32, above MA-20 ($447.82), MA-50 ($442.29), and MA-200 ($371.66), signaling broad bullish momentum.
- Momentum indicators are mixed: MACD gives a sell forecast and Stochastic RSI shows overbought conditions, raising caution for a near-term pullback or consolidation.
- Key levels include Ichimoku Kijun resistance at $458.14 and MA-50 support at $442.29; expected price range is $435.00 to $460.00 over the next five trading days.
Robotaxi milestone boosts demand as margin pressures challenge management
Tesla has reached a significant milestone by launching unsupervised robotaxi operations in Austin, enabling public riders to use vehicles without a human backup driver. In addition, the company deployed a record 14.2 GWh of energy storage products in the fourth quarter of 2025, reflecting strong demand for Megapack and Powerwall. Despite this, operating margins have compressed due to aggressive price cuts, and Tesla’s management remains under pressure for greater governance and succession transparency.
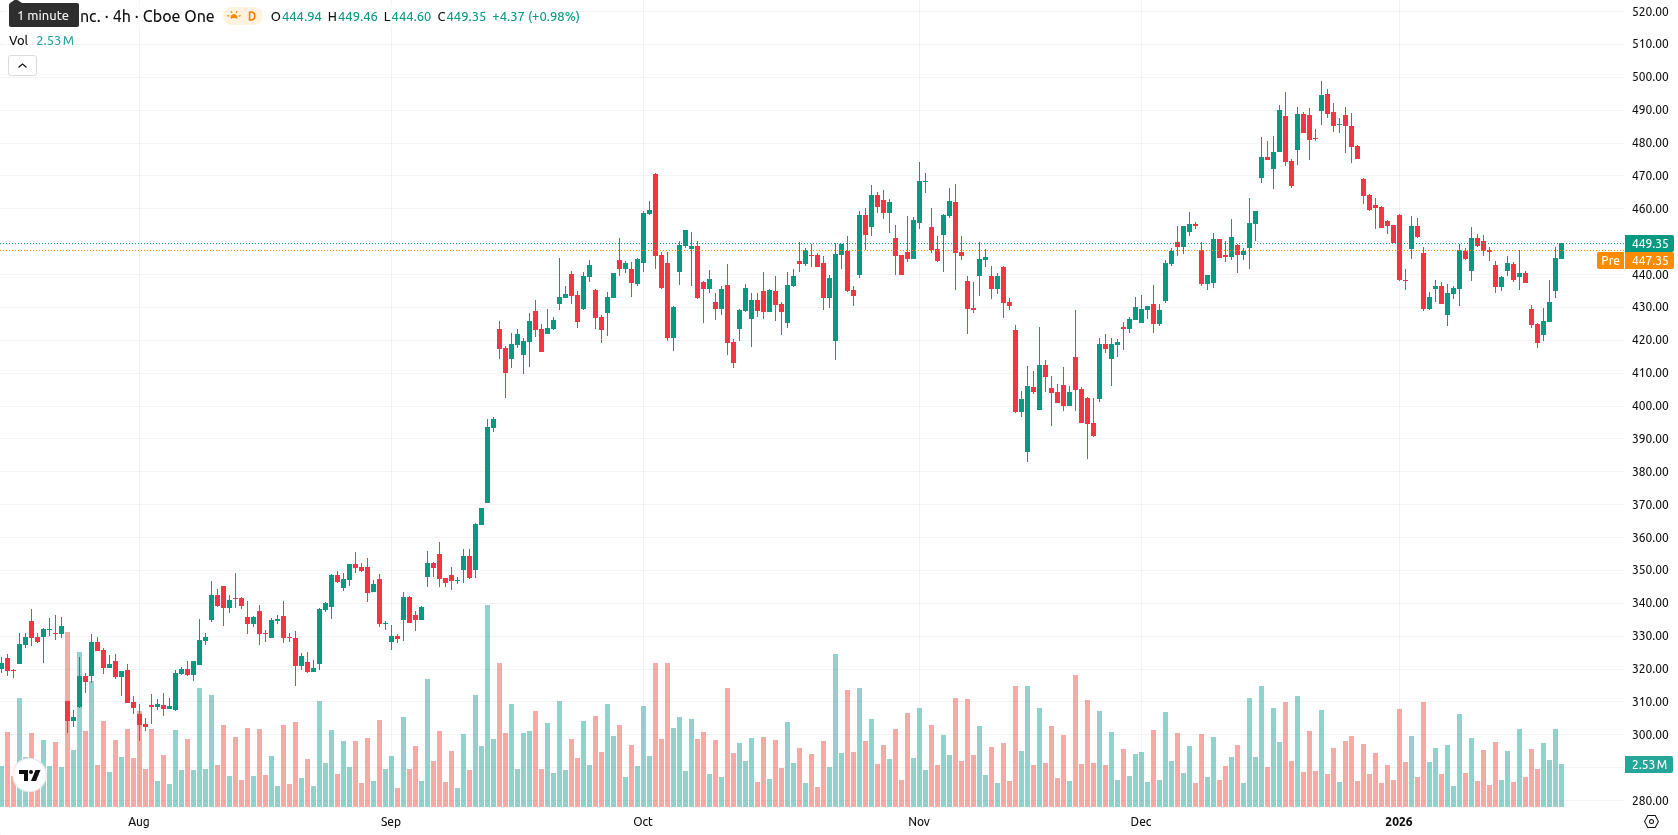
Buyer dominance signaled despite neutral trend and overbought warnings
Momentum indicators show a mixed picture: ADX remains neutral on D1, suggesting weak trend strength, while the MACD signals a potential pause with a sell forecast despite positive daily price action. Overbought readings on the Stochastic RSI and Bull/Bear Power, alongside a neutral Commodity Channel Index, point to buyer dominance but also raise caution for a near-term pullback. Daily performance shows a $3.00 gap up at the open, and TSLA is trading near today’s high in a $16.72 range, reflecting moderate volatility and continued strength toward the session highs; however, some oscillators diverge from the bullish tone, indicating possible consolidation or a slowdown in momentum.
Upside favored within consolidation band as volatility guides scenarios
Looking ahead, the expected price range for the next five trading days is $435.00 to $460.00, corresponding to a volatility band of roughly ±3% from current levels. There is a very high probability (more than 80%) of further price increase, with a low probability of a downside move. The baseline scenario assumes TSLA consolidates sideways within this range. A bullish scenario would see a break and hold above the Ichimoku Kijun, while a drop below the MA-50 would shift control to sellers.
Previously it was reported that Tesla's stock trend has shifted bullish, with prices rebounding off support and now trading above key moving averages supported by rising volume and a positive MACD. Technical indicators such as the RSI, currently in bullish territory but not overbought, and improving chart structure position the stock near a major resistance zone, with a breakout potentially driving the next upward leg.









-
 Afghanistan
-
 Albania
-
 Algeria
-
 Angola
-
 Argentina
-
 Armenia
-
 Australia
-
 Austria
-
 Azerbaijan
-
 Bahamas
-
 Bahrain
-
 Bangladesh
-
 Belarus
-
 Belgium
-
 Bolivia
-
 Botswana
-
 Brazil
-
 Brunei
-
 Bulgaria
-
 Cambodia
-
 Cameroon
-
 Canada
-
 Chile
Chile
-
 China
China
-
 Colombia
-
 Congo
Congo
-
 Costa Rica
-
 Cote d'Ivoire
-
 Croatia
-
 Cuba
Cuba
-
 Cyprus
-
 Czechia
-
 DR Congo
-
 Denmark
-
 Dominican Republic
-
 Ecuador
-
 Egypt
Egypt
-
 El Salvador
-
 Estonia
-
 Eswatini
-
 Ethiopia
-
 Finland
-
 France
-
 Georgia
-
 Germany
-
 Ghana
Ghana
-
 Greece
-
 Haiti
Haiti
-
 Hong Kong
-
 Hungary
-
 India
India
-
 Indonesia
-
 Iran, Islamic republic
-
 Iraq
Iraq
-
 Ireland
-
 Israel
-
 Italy
Italy
-
 Jamaica
-
 Japan
Japan
-
 Jordan
-
 Kazakhstan
-
 Kenya
Kenya
-
 Korea
Korea
-
 Kuwait
-
 Kyrgyzstan
-
 Laos
Laos
-
 Latvia
-
 Lebanon
-
 Lesotho
-
 Libya
Libya
-
 Lithuania
-
 Luxembourg
-
 Madagascar
-
 Malaysia
-
 Malta
Malta
-
 Mauritius
-
 Mexico
-
 Moldova
-
 Mongolia
-
 Montenegro
-
 Morocco
-
 Mozambique
-
 Myanmar
-
 Namibia
-
 Nepal
Nepal
-
 Netherlands
-
 New Zealand
-
 Nigeria
-
 North Macedonia
-
 Norway
-
 Oman
Oman
-
 Pakistan
-
 Palestine
-
 Panama
-
 Papua New Guinea
-
 Paraguay
-
 Peru
Peru
-
 Philippines
-
 Poland
-
 Portugal
-
 Puerto Rico
-
 Qatar
Qatar
-
 Reunion
-
 Romania
-
 Rwanda
-
 Saudi Arabia
-
 Serbia
-
 Singapore
-
 Slovakia
-
 Slovenia
-
 Somalia
-
 South Africa
-
 Spain
Spain
-
 Sri Lanka
-
 Sweden
-
 Switzerland
-
 Syria
Syria
-
 Taiwan
-
 Tajikistan
-
 Tanzania
-
 Thailand
-
 Trinidad and Tobago
-
 Tunisia
-
 Turkey
-
 UAE
UAE
-
 Uganda
-
 Ukraine
-
 United Kingdom
-
United States
-
 Uruguay
-
 Uzbekistan
-
 Venezuela
-
 Vietnam
-
 Yemen
Yemen
-
 Zambia
-
 Zimbabwe
- Forex
- Crypto











