
Alphabet stock price forecast: short-term volatility as GOOGL trades near support

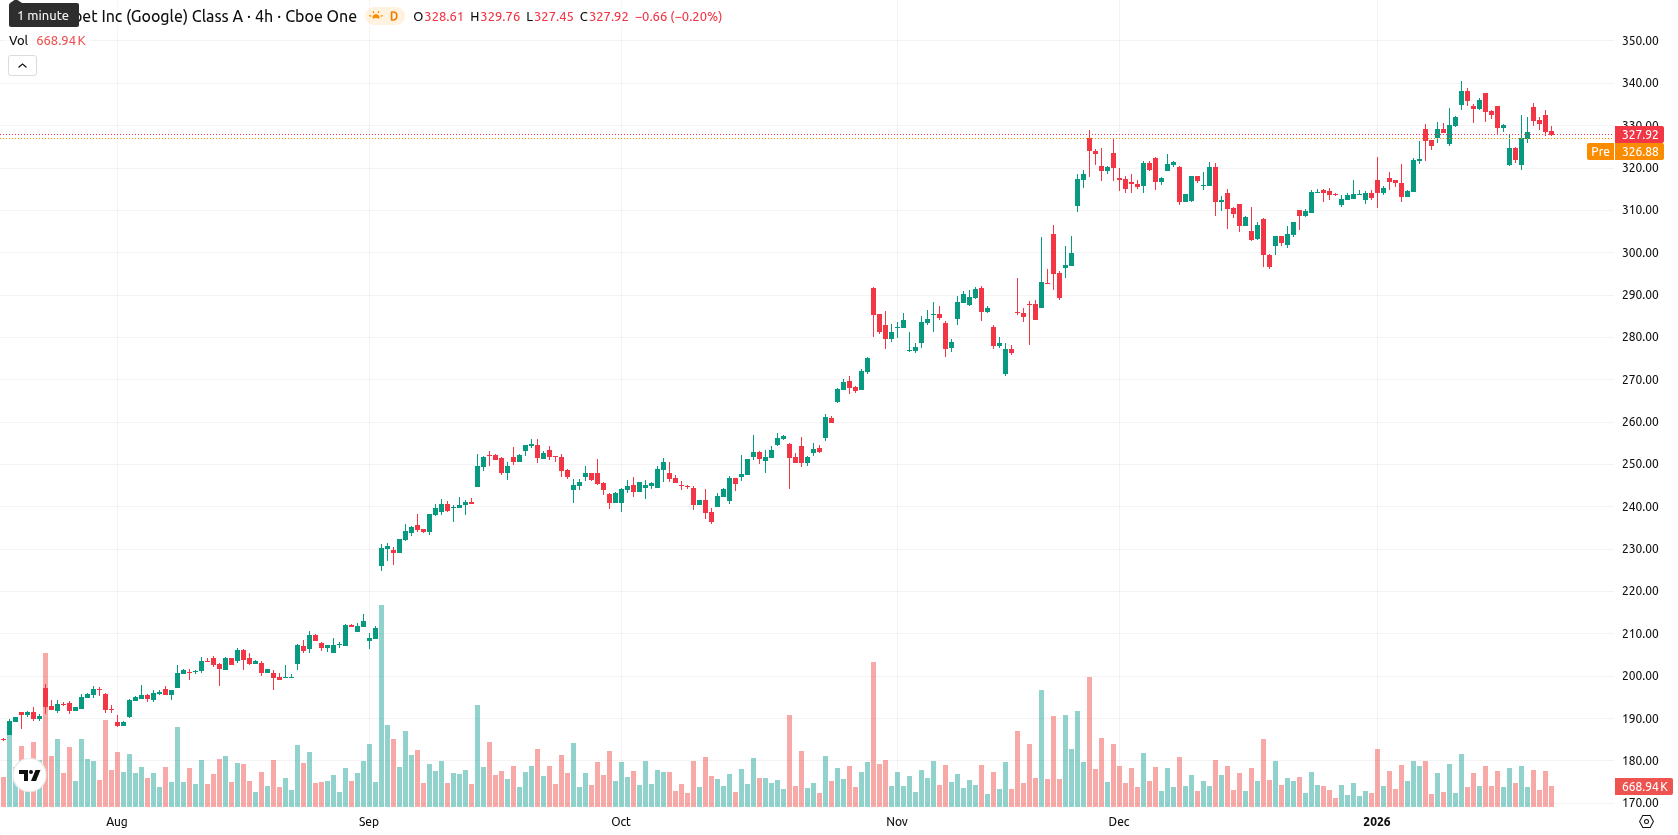
Alphabet Inc. (GOOGL, formerly Google) is trading at $327.92, above the MA-20 ($323.28), MA-50 ($312.77), and MA-200 ($229.91), confirming a bullish structure in both short- and long-term horizons. The MA-50 now acts as the nearest notable resistance, while dynamic support is seen at the Ichimoku Kijun ($318.31).
Highlights
- GOOGL is trading at $327.92, above all major moving averages (MA-20: $323.28, MA-50: $312.77, MA-200: $229.91), confirming a bullish structure across timeframes.
- Momentum remains strong with a bullish MACD signal and ADX at 27.88, but short-term oscillators show minor divergence and intraday weakness after a 0.79% price slip today.
- Next week's expected price range is $325.00–$335.00, with over 80% probability of consolidation or upside, while a drop below $325.00 could trigger further downside toward $318.31 (Ichimoku Kijun level).
AI partnership with Apple lifts sentiment amid valuation milestone
Alphabet has reinforced its position in artificial intelligence and cloud computing by entering a multiyear partnership with Apple, allowing Apple to utilize Google's Gemini models and cloud for foundational AI functions. Alphabet's market capitalization recently surpassed $4 trillion as these strategic developments unfolded. The company's fourth-quarter results are scheduled to be announced on February 4.
Mixed oscillators warn despite firm momentum and intraday volatility
Momentum is positive on the daily timeframe, with the MACD signalling Strong Buy and the ADX at 27.88 supporting the bullish trend, though some oscillators show divergence. The RSI is in Buy territory at 57.73, while the Stochastic RSI at 21.13 and CCI at 56.69 flag mild oversold readings. Bull/Bear Power is currently overbought, suggesting buyers have dominated, yet the price slipped 0.79% today and is near the low of the session, pointing to moderate intraday volatility and some pressure after the open. This combination of strong momentum but soft intraday action highlights a divergence between short-term weakness and broader bullish signals.
Sideways consolidation expected absent breakout or breakdown
For the next week, the expected range for GOOGL is $325.00 to $335.00, consistent with a typical ±3% volatility band relative to current levels. There is a very high probability (over 80%) of a price increase, as all key weekly indicators (RSI, ADX, MACD, MA-50) are aligned higher, making a pullback less likely. The baseline scenario is for the stock to consolidate sideways within this band. A bullish breakout above $335.00 could open the way to new highs, while a decline below $325.00 would likely trigger further downside toward the Ichimoku Kijun near $318.31.
Last time, analysts noted that Alphabet Inc. continued to exhibit strong bullish momentum, trading firmly above key moving averages with supportive readings from RSI, MACD, and ADX, while consolidating just below notable resistance. The stock maintained dynamic support near $318, with current technical indicators suggesting a high probability of further upside within projected volatility bands, barring a break below key support.


-
 Afghanistan
-
 Albania
-
 Algeria
-
 Angola
-
 Argentina
-
 Armenia
-
 Australia
-
 Austria
-
 Azerbaijan
-
 Bahamas
-
 Bahrain
-
 Bangladesh
-
 Belarus
-
 Belgium
-
 Bolivia
-
 Botswana
-
 Brazil
-
 Brunei
-
 Bulgaria
-
 Cambodia
-
 Cameroon
-
 Canada
-
 Chile
Chile
-
 China
China
-
 Colombia
-
 Congo
Congo
-
 Costa Rica
-
 Cote d'Ivoire
-
 Croatia
-
 Cuba
Cuba
-
 Cyprus
-
 Czechia
-
 DR Congo
-
 Denmark
-
 Dominican Republic
-
 Ecuador
-
 Egypt
Egypt
-
 El Salvador
-
 Estonia
-
 Eswatini
-
 Ethiopia
-
 Finland
-
 France
-
 Georgia
-
 Germany
-
 Ghana
Ghana
-
 Greece
-
 Haiti
Haiti
-
 Hong Kong
-
 Hungary
-
 India
India
-
 Indonesia
-
 Iran, Islamic republic
-
 Iraq
Iraq
-
 Ireland
-
 Israel
-
 Italy
Italy
-
 Jamaica
-
 Japan
Japan
-
 Jordan
-
 Kazakhstan
-
 Kenya
Kenya
-
 Korea
Korea
-
 Kuwait
-
 Kyrgyzstan
-
 Laos
Laos
-
 Latvia
-
 Lebanon
-
 Lesotho
-
 Libya
Libya
-
 Lithuania
-
 Luxembourg
-
 Madagascar
-
 Malaysia
-
 Malta
Malta
-
 Mauritius
-
 Mexico
-
 Moldova
-
 Mongolia
-
 Montenegro
-
 Morocco
-
 Mozambique
-
 Myanmar
-
 Namibia
-
 Nepal
Nepal
-
 Netherlands
-
 New Zealand
-
 Nigeria
-
 North Macedonia
-
 Norway
-
 Oman
Oman
-
 Pakistan
-
 Palestine
-
 Panama
-
 Papua New Guinea
-
 Paraguay
-
 Peru
Peru
-
 Philippines
-
 Poland
-
 Portugal
-
 Puerto Rico
-
 Qatar
Qatar
-
 Reunion
-
 Romania
-
 Rwanda
-
 Saudi Arabia
-
 Serbia
-
 Singapore
-
 Slovakia
-
 Slovenia
-
 Somalia
-
 South Africa
-
 Spain
Spain
-
 Sri Lanka
-
 Sweden
-
 Switzerland
-
 Syria
Syria
-
 Taiwan
-
 Tajikistan
-
 Tanzania
-
 Thailand
-
 Trinidad and Tobago
-
 Tunisia
-
 Turkey
-
 UAE
UAE
-
 Uganda
-
 Ukraine
-
 United Kingdom
-
United States
-
 Uruguay
-
 Uzbekistan
-
 Venezuela
-
 Vietnam
-
 Yemen
Yemen
-
 Zambia
-
 Zimbabwe
- Forex
- Crypto
