
Comcast stock price forecast: mixed momentum signals as CMCSA surges 4.22% above short-term averages

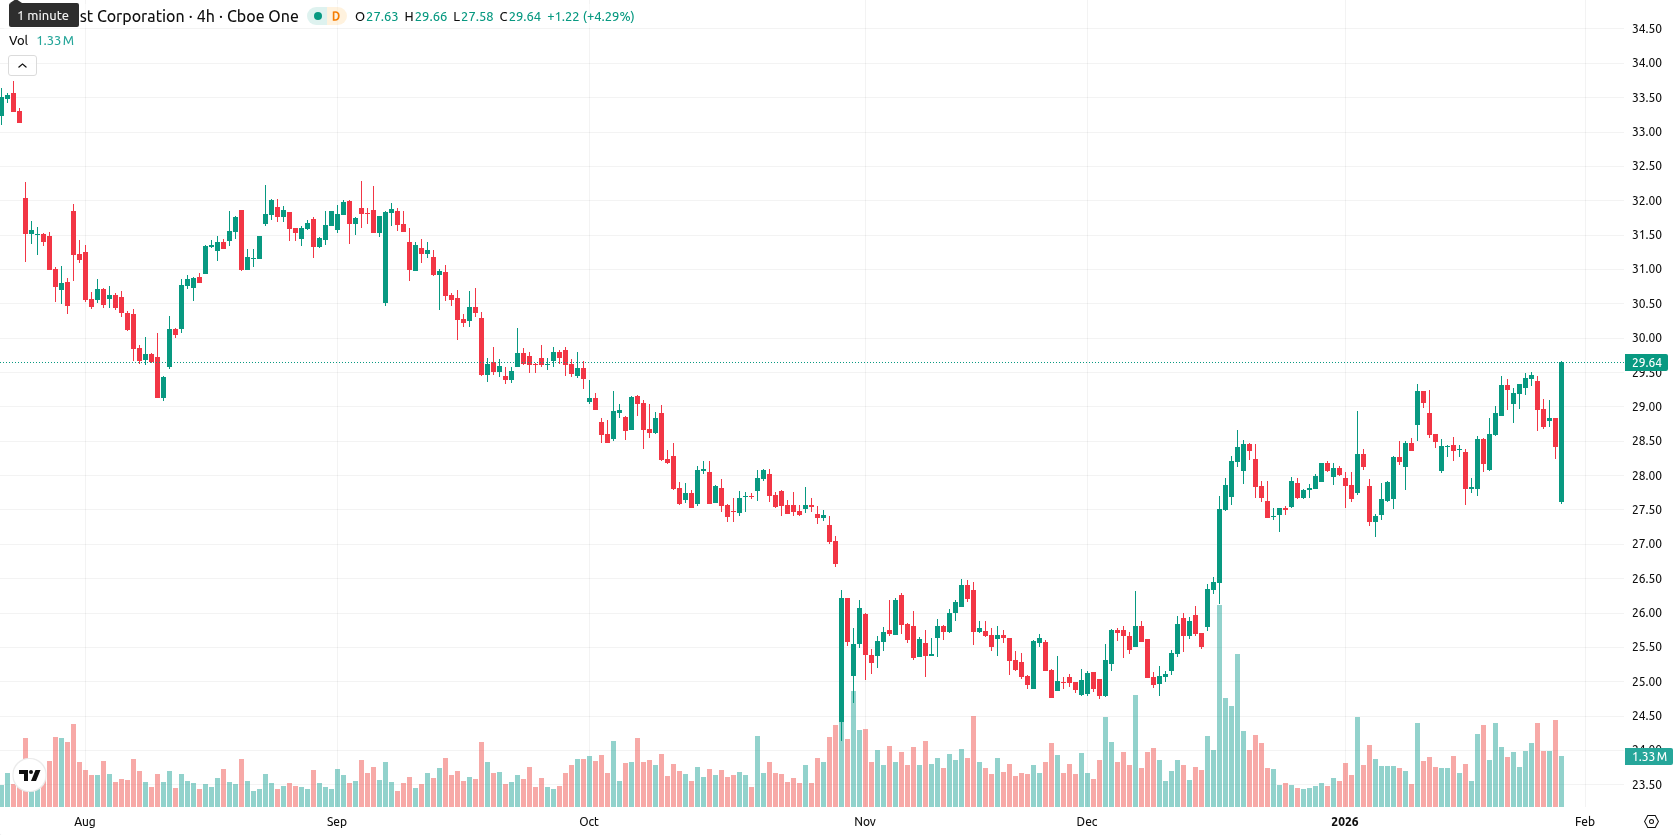
Comcast Corporation (CMCSA) is trading at $29.61, which is above both the MA-20 ($28.50) and MA-50 ($28.13) but remains below the MA-200 ($31.74). This setup signals short- and medium-term bullish momentum, while the longer-term trend remains pressured by sellers; dynamic support is seen at the Ichimoku Kijun ($28.72), with resistance near the MA-200 and the $30 round level.
Highlights
- Comcast reported Q4 2025 revenue of approximately $32.31 billion, meeting consensus, and delivered adjusted EPS of $0.84, which surpassed expectations.
- The company generated $4.4 billion in free cash flow and returned $11.7 billion to shareholders in 2025, while keeping the annual dividend unchanged at $1.32 per share for 2026.
- Technically, CMCSA trades at $29.61—above its MA-20 and MA-50 but below MA-200—with key price levels between $28.70 support and $29.90 resistance, indicating range-bound consolidation.
Earnings beat amid subscriber losses and flat dividend outlook
Comcast reported fourth-quarter 2025 revenue of approximately $32.31 billion, in line with consensus, and adjusted EPS of $0.84, beating expectations. The company generated free cash flow of about $4.4 billion and returned $11.7 billion to shareholders during the year. Continued broadband customer losses and wider losses at its Peacock streaming unit weighed on results, while the annual dividend was kept unchanged at $1.32 per share for 2026.
Mixed momentum as oscillators diverge despite intraday buying
Momentum signals on the daily chart are mixed: the MACD supports a modest bullish bias, but the ADX remains neutral with low trend strength. RSI sits in the neutral zone, but its "Sell" signal and the Stochastic RSI's low reading suggest there is no significant overbought or oversold condition, though CCI is also neutral. Bull/Bear Power is positive, indicating buyers have intraday dominance, but this is contradicted by neutral or weak signals from other oscillators. The current session saw no gap at the open, and price surged to the high end of today's range after the open, suggesting moderate volatility and clear upward pressure.
Range-bound outlook as bearish weekly signals outweigh upside
For the next five trading days, the expected price corridor is $28.80 to $29.90. The probability of further price increases is very low (less than 20%), while a downward or sideways move is more likely due to dominant bearish weekly momentum across the Moving Average, RSI, ADX, and MACD. In the baseline scenario, CMCSA remains range-bound between support at $28.70 and resistance near $29.90. A bullish break above $29.90 could open room toward the $31 level, while a bearish move below $28.70 would likely trigger a retest toward the $28 area.
Last time, analysts noted that Comcast opened sharply lower trading below all major moving averages except the MA-50, highlighting continuing downward pressure with sellers maintaining control. Technical momentum is mixed, as bullish daily MACD and ADX contrast with buy territory RSI and CCI and a neutral Stoch RSI, while key support and resistance levels are set near $28.49 and $28.08, respectively, adding caution for short-term traders.


-
 Afghanistan
-
 Albania
-
 Algeria
-
 Angola
-
 Argentina
-
 Armenia
-
 Australia
-
 Austria
-
 Azerbaijan
-
 Bahamas
-
 Bahrain
-
 Bangladesh
-
 Belarus
-
 Belgium
-
 Bolivia
-
 Botswana
-
 Brazil
-
 Brunei
-
 Bulgaria
-
 Cambodia
-
 Cameroon
-
 Canada
-
 Chile
Chile
-
 China
China
-
 Colombia
-
 Congo
Congo
-
 Costa Rica
-
 Cote d'Ivoire
-
 Croatia
-
 Cuba
Cuba
-
 Cyprus
-
 Czechia
-
 DR Congo
-
 Denmark
-
 Dominican Republic
-
 Ecuador
-
 Egypt
Egypt
-
 El Salvador
-
 Estonia
-
 Eswatini
-
 Ethiopia
-
 Finland
-
 France
-
 Georgia
-
 Germany
-
 Ghana
Ghana
-
 Greece
-
 Haiti
Haiti
-
 Hong Kong
-
 Hungary
-
 India
India
-
 Indonesia
-
 Iran, Islamic republic
-
 Iraq
Iraq
-
 Ireland
-
 Israel
-
 Italy
Italy
-
 Jamaica
-
 Japan
Japan
-
 Jordan
-
 Kazakhstan
-
 Kenya
Kenya
-
 Korea
Korea
-
 Kuwait
-
 Kyrgyzstan
-
 Laos
Laos
-
 Latvia
-
 Lebanon
-
 Lesotho
-
 Libya
Libya
-
 Lithuania
-
 Luxembourg
-
 Madagascar
-
 Malaysia
-
 Malta
Malta
-
 Mauritius
-
 Mexico
-
 Moldova
-
 Mongolia
-
 Montenegro
-
 Morocco
-
 Mozambique
-
 Myanmar
-
 Namibia
-
 Nepal
Nepal
-
 Netherlands
-
 New Zealand
-
 Nigeria
-
 North Macedonia
-
 Norway
-
 Oman
Oman
-
 Pakistan
-
 Palestine
-
 Panama
-
 Papua New Guinea
-
 Paraguay
-
 Peru
Peru
-
 Philippines
-
 Poland
-
 Portugal
-
 Puerto Rico
-
 Qatar
Qatar
-
 Reunion
-
 Romania
-
 Rwanda
-
 Saudi Arabia
-
 Serbia
-
 Singapore
-
 Slovakia
-
 Slovenia
-
 Somalia
-
 South Africa
-
 Spain
Spain
-
 Sri Lanka
-
 Sweden
-
 Switzerland
-
 Syria
Syria
-
 Taiwan
-
 Tajikistan
-
 Tanzania
-
 Thailand
-
 Trinidad and Tobago
-
 Tunisia
-
 Turkey
-
 UAE
UAE
-
 Uganda
-
 Ukraine
-
 United Kingdom
-
United States
-
 Uruguay
-
 Uzbekistan
-
 Venezuela
-
 Vietnam
-
 Yemen
Yemen
-
 Zambia
-
 Zimbabwe
- Forex
- Crypto
