
Consolidation for Apple stock — technicals remain strong despite overbought warnings

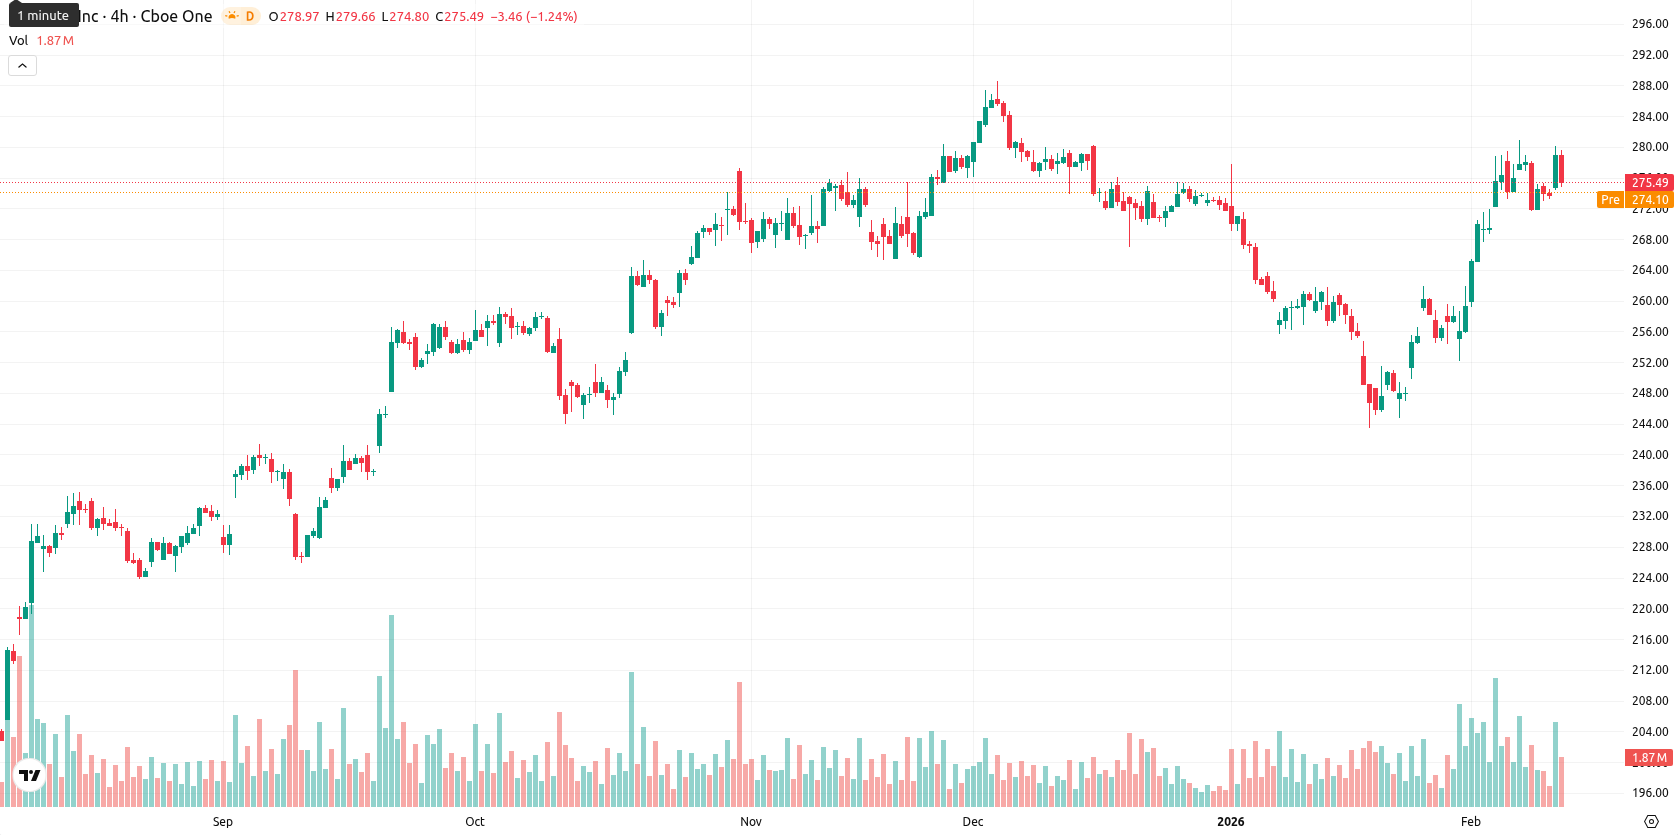
Apple Inc. (AAPL) is trading at $275.67, well above the MA-20 ($262.34), MA-50 ($268.52), and MA-200 ($239.58), signaling bullish momentum across short-, mid-, and long-term trends. The current price remains firmly positioned above these key moving averages.
Highlights
- Apple faces regulatory scrutiny from the U.S. Federal Trade Commission over alleged political bias in its News platform, increasing risks of legal and operational challenges.
- Ongoing US-India trade negotiations may introduce new digital regulations and tariffs, potentially impacting Apple's costs and market access in key international growth regions.
- Apple shares trade at $275.67, showing bullish momentum above all major moving averages, with consolidation expected between $270 and $282 over the next five trading days.
Regulatory scrutiny and global cyber risks elevate operational uncertainty
Apple currently faces regulatory scrutiny in the United States from the Federal Trade Commission over alleged political bias in its News platform, raising the risks of legal action and potential operational restrictions. Additional pressure comes from U.S. government warnings on compliance and content moderation, underscoring heightened tensions with federal authorities. Internationally, the company navigates increased cyber vulnerabilities and exposure to advanced cyberattacks, alongside shifting digital regulations and tariffs stemming from US-India trade negotiations that could impact its access and costs in key growth markets.
Upward move faces overbought signals as momentum divergence emerges
Momentum remains positive as the daily MACD confirms a buy signal, while the ADX indicates a neutral trend, pointing to an upward move that is not strongly directional. The nearest dynamic support is at the Ichimoku Kijun ($262.15), with resistance likely at the MA-50 and the recent round number near $280. The RSI and CCI hover in overbought territory, and the Stochastic RSI and Bull/Bear Power also reflect overbought intraday conditions and buyer dominance. The Awesome Oscillator supports the current bullish tone, but short-term oscillators warn of possible exhaustion with momentum divergence and stretched overbought readings.
Directional breakout favored as volatility expectations tighten
For the next five trading days, Apple is expected to move within a typical volatility band of $270 to $282. Given the strong bullish signals from weekly indicators, the probability of an upward move is very high (over 80%), making a short-term decline less likely. Baseline expectations favor consolidation between $270 and $282 as buyers absorb recent gains. A break above $282 would indicate a bullish extension, while a move below $270 could trigger a corrective pullback toward dynamic supports.
Previously it was reported that Apple Inc. is exhibiting strong bullish momentum, trading substantially above key short-, medium-, and long-term moving averages, with positive sentiment driven by AI integration and growth in its services segment. Technical indicators, including the MACD and oscillators, show continued upward pressure but also signal overbought conditions, raising the prospect of a short-term pullback as resistance approaches.


-
 Afghanistan
-
 Albania
-
 Algeria
-
 Angola
-
 Argentina
-
 Armenia
-
 Australia
-
 Austria
-
 Azerbaijan
-
 Bahamas
-
 Bahrain
-
 Bangladesh
-
 Belarus
-
 Belgium
-
 Bolivia
-
 Botswana
-
 Brazil
-
 Brunei
-
 Bulgaria
-
 Cambodia
-
 Cameroon
-
 Canada
-
 Chile
Chile
-
 China
China
-
 Colombia
-
 Congo
Congo
-
 Costa Rica
-
 Cote d'Ivoire
-
 Croatia
-
 Cuba
Cuba
-
 Cyprus
-
 Czechia
-
 DR Congo
-
 Denmark
-
 Dominican Republic
-
 Ecuador
-
 Egypt
Egypt
-
 El Salvador
-
 Estonia
-
 Eswatini
-
 Ethiopia
-
 Finland
-
 France
-
 Georgia
-
 Germany
-
 Ghana
Ghana
-
 Greece
-
 Haiti
Haiti
-
 Hong Kong
-
 Hungary
-
 India
India
-
 Indonesia
-
 Iran, Islamic republic
-
 Iraq
Iraq
-
 Ireland
-
 Israel
-
 Italy
Italy
-
 Jamaica
-
 Japan
Japan
-
 Jordan
-
 Kazakhstan
-
 Kenya
Kenya
-
 Korea
Korea
-
 Kuwait
-
 Kyrgyzstan
-
 Laos
Laos
-
 Latvia
-
 Lebanon
-
 Lesotho
-
 Libya
Libya
-
 Lithuania
-
 Luxembourg
-
 Madagascar
-
 Malaysia
-
 Malta
Malta
-
 Mauritius
-
 Mexico
-
 Moldova
-
 Mongolia
-
 Montenegro
-
 Morocco
-
 Mozambique
-
 Myanmar
-
 Namibia
-
 Nepal
Nepal
-
 Netherlands
-
 New Zealand
-
 Nigeria
-
 North Macedonia
-
 Norway
-
 Oman
Oman
-
 Pakistan
-
 Palestine
-
 Panama
-
 Papua New Guinea
-
 Paraguay
-
 Peru
Peru
-
 Philippines
-
 Poland
-
 Portugal
-
 Puerto Rico
-
 Qatar
Qatar
-
 Reunion
-
 Romania
-
 Rwanda
-
 Saudi Arabia
-
 Serbia
-
 Singapore
-
 Slovakia
-
 Slovenia
-
 Somalia
-
 South Africa
-
 Spain
Spain
-
 Sri Lanka
-
 Sweden
-
 Switzerland
-
 Syria
Syria
-
 Taiwan
-
 Tajikistan
-
 Tanzania
-
 Thailand
-
 Trinidad and Tobago
-
 Tunisia
-
 Turkey
-
 UAE
UAE
-
 Uganda
-
 Ukraine
-
 United Kingdom
-
United States
-
 Uruguay
-
 Uzbekistan
-
 Venezuela
-
 Vietnam
-
 Yemen
Yemen
-
 Zambia
-
 Zimbabwe
- Forex
- Crypto
