
+4.22% for Bit Digital stock — intraday recovery bucks prevailing seller control

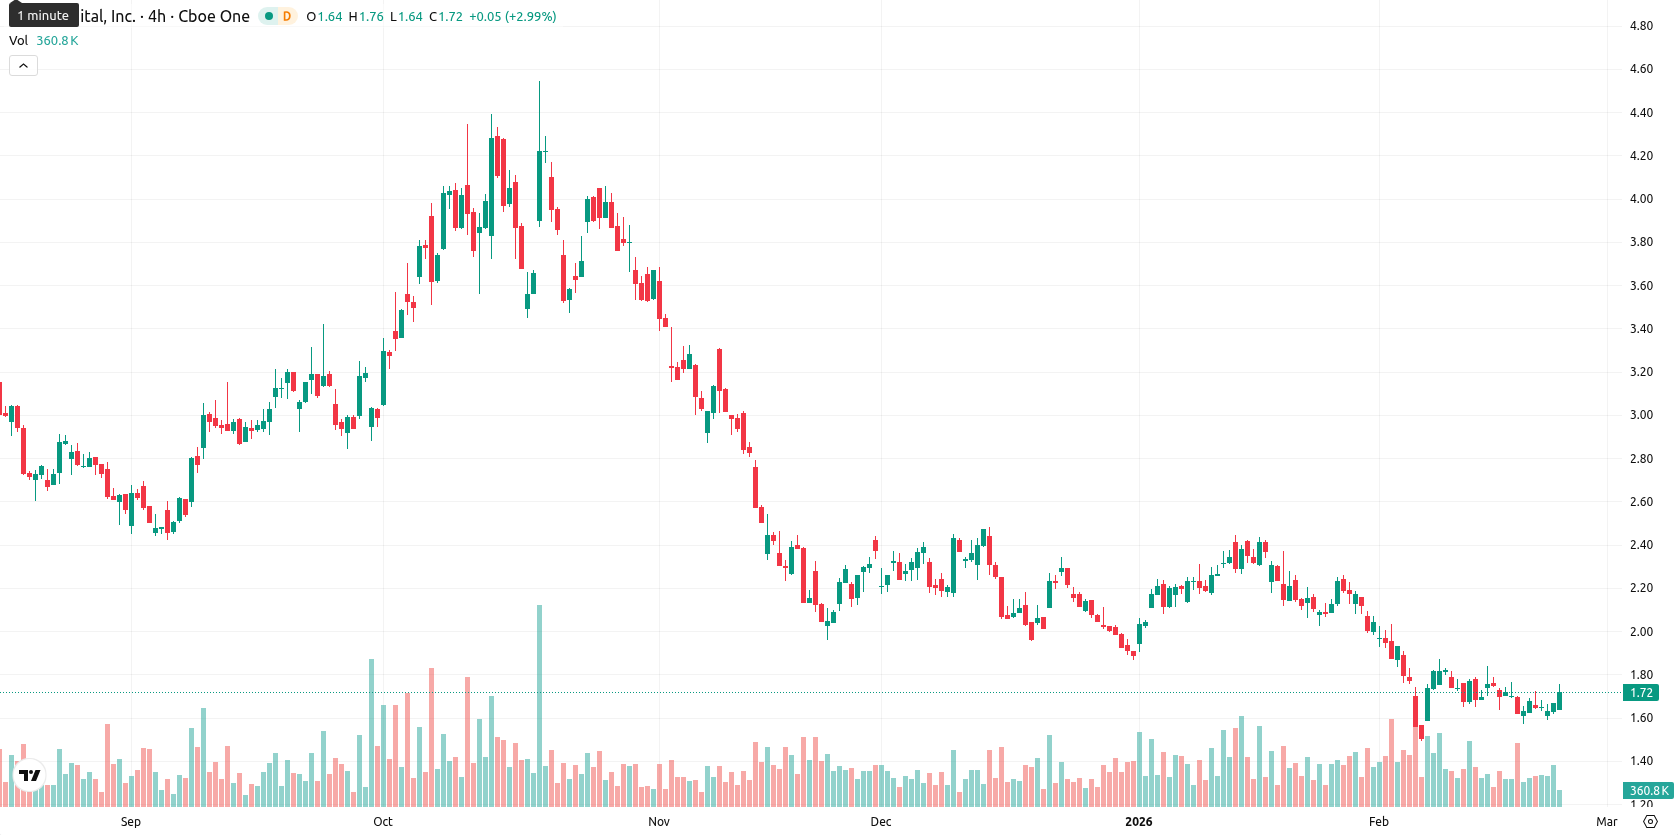
Bit Digital Inc (BTBT) is trading at $1.73, which is below the MA-20 ($1.83), MA-50 ($2.04), and MA-200 ($2.69), indicating persistent short-, medium-, and long-term bearish pressure from sellers. The Ichimoku Kijun level sits at $1.97, acting as immediate resistance above the current price.
Highlights
- BTBT trades at $1.73, remaining below the MA-20 ($1.83), MA-50 ($2.04), and MA-200 ($2.69), underscoring a persistent bearish trend across all timeframes.
- Technical momentum is weak, with a negative MACD, ADX, and Bull/Bear Power, while the RSI (38.74) and CCI (–79.09) approach oversold territory.
- Immediate resistance sits at $1.97 and support at $1.63; the expected weekly range is $1.63–$1.83, with <20% probability of a sustained upside break.
Intra-day buying emerges amid diverging oscillators and weak momentum
Momentum remains weak, with the MACD and ADX both signaling a lack of bullish conviction. The RSI (38.74) and Commodity Channel Index (–79.09) are both tilted towards oversold territory, though the Stochastic RSI is now showing overbought conditions, highlighting a divergence among oscillators. Bull/Bear Power is negative, indicating that sellers still dominate today’s intraday action. After opening just below the previous close (no significant gap), the price quickly recovered and moved higher, currently sitting near the top of today's range ($1.64 – $1.76), with volatility best described as moderate and the tone as one of strength toward the highs. However, the intraday momentum differs from the larger timeframe bearish structure, reflecting short-term buying activity against a weak technical background.
Sideways bias prevails as bearish signals limit breakout potential
Looking ahead, the expected range over the next week is adjusted to $1.63 – $1.83, keeping the price within a typical volatility band relative to current levels. There is a very low probability (less than 20%) of a sustained upward move, while a further decline remains more likely given the bearish configuration of the weekly indicators — RSI, ADX, MACD, and all major Moving Averages point downward. The baseline scenario sees BTBT moving sideways between immediate support and resistance. In a bullish scenario, a break above immediate resistance ($1.97) could open the way for a test toward higher levels, while a decisive move below $1.63 would reinforce seller control and expose the stock to deeper declines.
Previously it was reported that Bit Digital Inc. (BTBT) is under persistent bearish pressure across all major moving averages, with the price trading below key short-, medium-, and long-term trend levels. Momentum indicators, including MACD, ADX, and RSI, confirm ongoing weakness, while sellers maintain control and immediate resistance is identified near $1.97.


Latest Bit Digital News


-
 Afghanistan
-
 Albania
-
 Algeria
-
 Angola
-
 Argentina
-
 Armenia
-
 Australia
-
 Austria
-
 Azerbaijan
-
 Bahamas
-
 Bahrain
-
 Bangladesh
-
 Belarus
-
 Belgium
-
 Bolivia
-
 Botswana
-
 Brazil
-
 Brunei
-
 Bulgaria
-
 Cambodia
-
 Cameroon
-
 Canada
-
 Chile
Chile
-
 China
China
-
 Colombia
-
 Congo
Congo
-
 Costa Rica
-
 Cote d'Ivoire
-
 Croatia
-
 Cuba
Cuba
-
 Cyprus
-
 Czechia
-
 DR Congo
-
 Denmark
-
 Dominican Republic
-
 Ecuador
-
 Egypt
Egypt
-
 El Salvador
-
 Estonia
-
 Eswatini
-
 Ethiopia
-
 Finland
-
 France
-
 Georgia
-
 Germany
-
 Ghana
Ghana
-
 Greece
-
 Haiti
Haiti
-
 Hong Kong
-
 Hungary
-
 India
India
-
 Indonesia
-
 Iran, Islamic republic
-
 Iraq
Iraq
-
 Ireland
-
 Israel
-
 Italy
Italy
-
 Jamaica
-
 Japan
Japan
-
 Jordan
-
 Kazakhstan
-
 Kenya
Kenya
-
 Korea
Korea
-
 Kuwait
-
 Kyrgyzstan
-
 Laos
Laos
-
 Latvia
-
 Lebanon
-
 Lesotho
-
 Libya
Libya
-
 Lithuania
-
 Luxembourg
-
 Madagascar
-
 Malaysia
-
 Malta
Malta
-
 Mauritius
-
 Mexico
-
 Moldova
-
 Mongolia
-
 Montenegro
-
 Morocco
-
 Mozambique
-
 Myanmar
-
 Namibia
-
 Nepal
Nepal
-
 Netherlands
-
 New Zealand
-
 Nigeria
-
 North Macedonia
-
 Norway
-
 Oman
Oman
-
 Pakistan
-
 Palestine
-
 Panama
-
 Papua New Guinea
-
 Paraguay
-
 Peru
Peru
-
 Philippines
-
 Poland
-
 Portugal
-
 Puerto Rico
-
 Qatar
Qatar
-
 Reunion
-
 Romania
-
 Rwanda
-
 Saudi Arabia
-
 Serbia
-
 Singapore
-
 Slovakia
-
 Slovenia
-
 Somalia
-
 South Africa
-
 Spain
Spain
-
 Sri Lanka
-
 Sweden
-
 Switzerland
-
 Syria
Syria
-
 Taiwan
-
 Tajikistan
-
 Tanzania
-
 Thailand
-
 Trinidad and Tobago
-
 Tunisia
-
 Turkey
-
 UAE
UAE
-
 Uganda
-
 Ukraine
-
 United Kingdom
-
United States
-
 Uruguay
-
 Uzbekistan
-
 Venezuela
-
 Vietnam
-
 Yemen
Yemen
-
 Zambia
-
 Zimbabwe
- Forex
- Crypto
