
Meta stock: Technical resistance and mixed indicators spark a 2.21% bounce

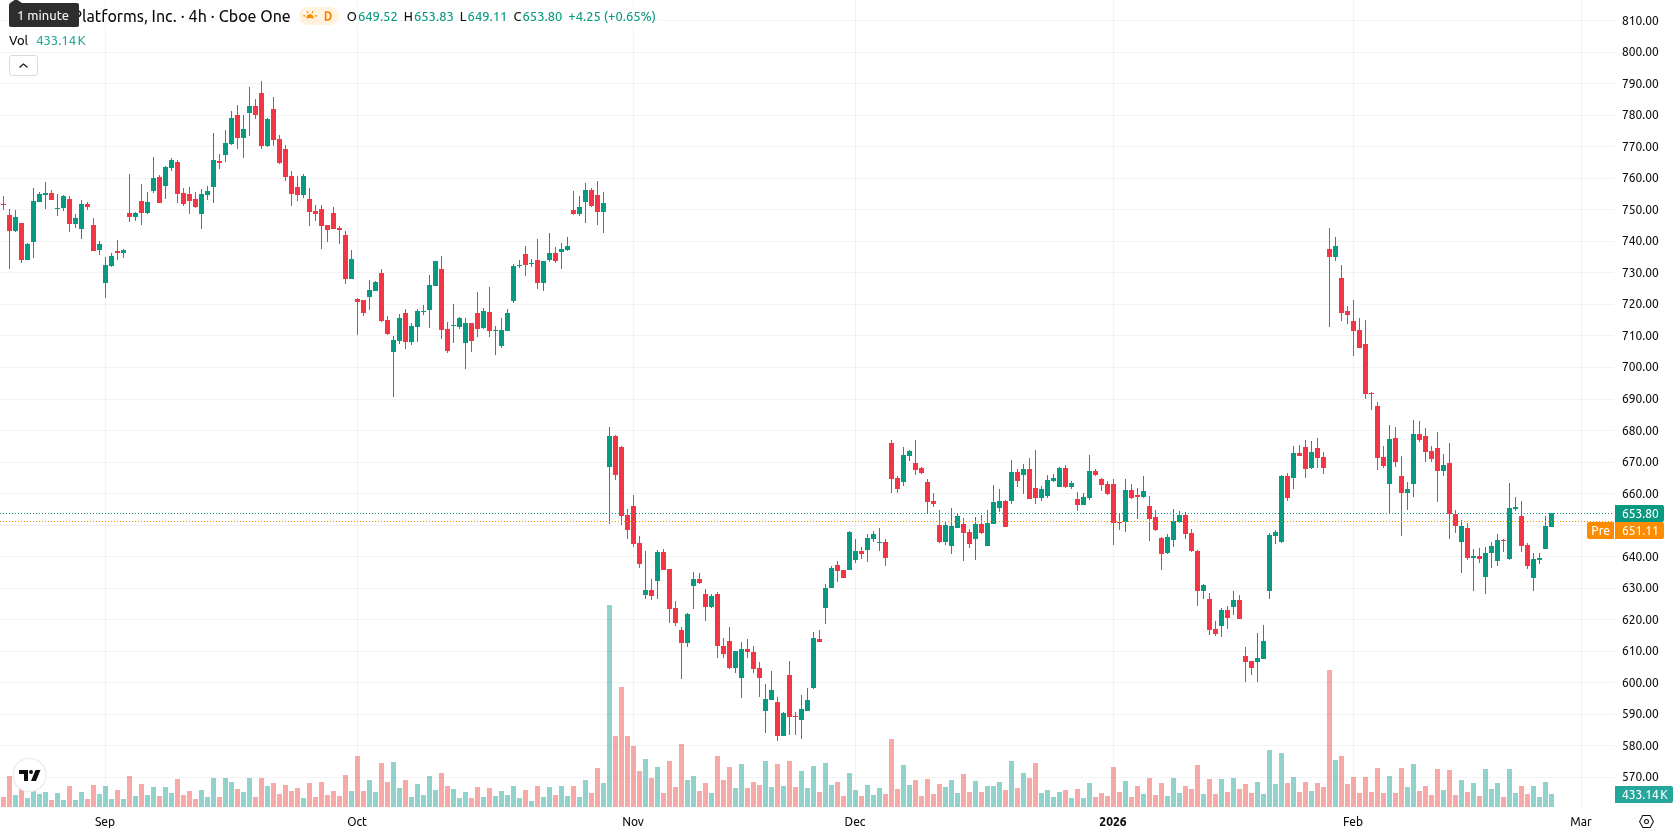
Meta Platforms, Inc. (META, formerly Facebook) is trading at $653.46, below the MA-20 ($667.11), MA-50 ($656.47), and MA-200 ($690.94), which signals short- and medium-term downside pressure. The price remains under these key moving averages, with the Ichimoku Kijun level at $672.00 acting as immediate resistance.
Highlights
- Meta reported 24% year-over-year revenue growth in Q4 2025 and invested heavily in AI infrastructure via a multi-year partnership with AMD.
- In 2025, Meta returned $31.6 billion to shareholders through $26.3 billion in share repurchases and $5.3 billion in dividends, despite ongoing IRS disputes over offshore intellectual property.
- META trades at $653.46, below key moving averages, with $672.00 as immediate resistance and likely price consolidation between $630 and $675 next week.
AI expansion and shareholder exits amid increased spending and legal risks
Meta has advanced its artificial intelligence infrastructure with a major multi-year partnership with AMD, highlighting a significant investment in AI data center capacity. The company reported 24% year-over-year revenue growth for the fourth quarter of 2025 and returned $31.6 billion to shareholders in 2025 through $26.3 billion in share repurchases and $5.3 billion in dividends. Increased AI spending and capital expenditures have raised some investor concerns, with notable shareholder exits, while consistent free cash flow has been partly offset by higher debt and stock-based compensation. Meta is also in an ongoing dispute with the IRS over the valuation of offshore intellectual property transfers, which could impact future tax treatment of technology assets.
Intraday buying strength contrasts with weak broader momentum
On the daily chart, momentum is weak as both the MACD and ADX point to selling pressure or neutral trend strength. Traditional oscillators like RSI and CCI are below 50, signaling mild bearishness, while the Stochastic RSI and Bull/Bear Power indicate overbought conditions and current buyer dominance in intraday moves. META gained 2.21% intraday with a minor opening gap, closing near the high in a session marked by high volatility and strong upward tone. There is a notable divergence between overbought oscillator readings and broader weak momentum, underscoring caution as short-term buying pressure contrasts with the underlying trend.
Downside bias as consolidation persists inside projected range
For the next week, the projected five-day trading range is $630 to $675 based on a typical volatility band relative to current levels. The likelihood of a price increase is low (less than 20%), while downside scenarios are favored given the majority of 'Sell' signals across weekly indicators. The expected path is a sideways move as META consolidates within this range. A breakout above $672.00 is required for a more bullish scenario, while a drop below $630 would suggest renewed downward momentum.
Last time, analysts noted that Meta Platforms Inc. traded below key moving averages with mixed momentum signals and multiple oscillators indicating oversold conditions. Resistance remains near the MA-50 and Ichimoku Kijun, while price action reflects ongoing downward pressure and near-term market uncertainty.


-
 Afghanistan
-
 Albania
-
 Algeria
-
 Angola
-
 Argentina
-
 Armenia
-
 Australia
-
 Austria
-
 Azerbaijan
-
 Bahamas
-
 Bahrain
-
 Bangladesh
-
 Belarus
-
 Belgium
-
 Bolivia
-
 Botswana
-
 Brazil
-
 Brunei
-
 Bulgaria
-
 Cambodia
-
 Cameroon
-
 Canada
-
 Chile
Chile
-
 China
China
-
 Colombia
-
 Congo
Congo
-
 Costa Rica
-
 Cote d'Ivoire
-
 Croatia
-
 Cuba
Cuba
-
 Cyprus
-
 Czechia
-
 DR Congo
-
 Denmark
-
 Dominican Republic
-
 Ecuador
-
 Egypt
Egypt
-
 El Salvador
-
 Estonia
-
 Eswatini
-
 Ethiopia
-
 Finland
-
 France
-
 Georgia
-
 Germany
-
 Ghana
Ghana
-
 Greece
-
 Haiti
Haiti
-
 Hong Kong
-
 Hungary
-
 India
India
-
 Indonesia
-
 Iran, Islamic republic
-
 Iraq
Iraq
-
 Ireland
-
 Israel
-
 Italy
Italy
-
 Jamaica
-
 Japan
Japan
-
 Jordan
-
 Kazakhstan
-
 Kenya
Kenya
-
 Korea
Korea
-
 Kuwait
-
 Kyrgyzstan
-
 Laos
Laos
-
 Latvia
-
 Lebanon
-
 Lesotho
-
 Libya
Libya
-
 Lithuania
-
 Luxembourg
-
 Madagascar
-
 Malaysia
-
 Malta
Malta
-
 Mauritius
-
 Mexico
-
 Moldova
-
 Mongolia
-
 Montenegro
-
 Morocco
-
 Mozambique
-
 Myanmar
-
 Namibia
-
 Nepal
Nepal
-
 Netherlands
-
 New Zealand
-
 Nigeria
-
 North Macedonia
-
 Norway
-
 Oman
Oman
-
 Pakistan
-
 Palestine
-
 Panama
-
 Papua New Guinea
-
 Paraguay
-
 Peru
Peru
-
 Philippines
-
 Poland
-
 Portugal
-
 Puerto Rico
-
 Qatar
Qatar
-
 Reunion
-
 Romania
-
 Rwanda
-
 Saudi Arabia
-
 Serbia
-
 Singapore
-
 Slovakia
-
 Slovenia
-
 Somalia
-
 South Africa
-
 Spain
Spain
-
 Sri Lanka
-
 Sweden
-
 Switzerland
-
 Syria
Syria
-
 Taiwan
-
 Tajikistan
-
 Tanzania
-
 Thailand
-
 Trinidad and Tobago
-
 Tunisia
-
 Turkey
-
 UAE
UAE
-
 Uganda
-
 Ukraine
-
 United Kingdom
-
United States
-
 Uruguay
-
 Uzbekistan
-
 Venezuela
-
 Vietnam
-
 Yemen
Yemen
-
 Zambia
-
 Zimbabwe
- Forex
- Crypto
