
AST SpaceMobile stock price forecast: New deals and bullish outlook as ASTS climbs 3.33% to $85.10

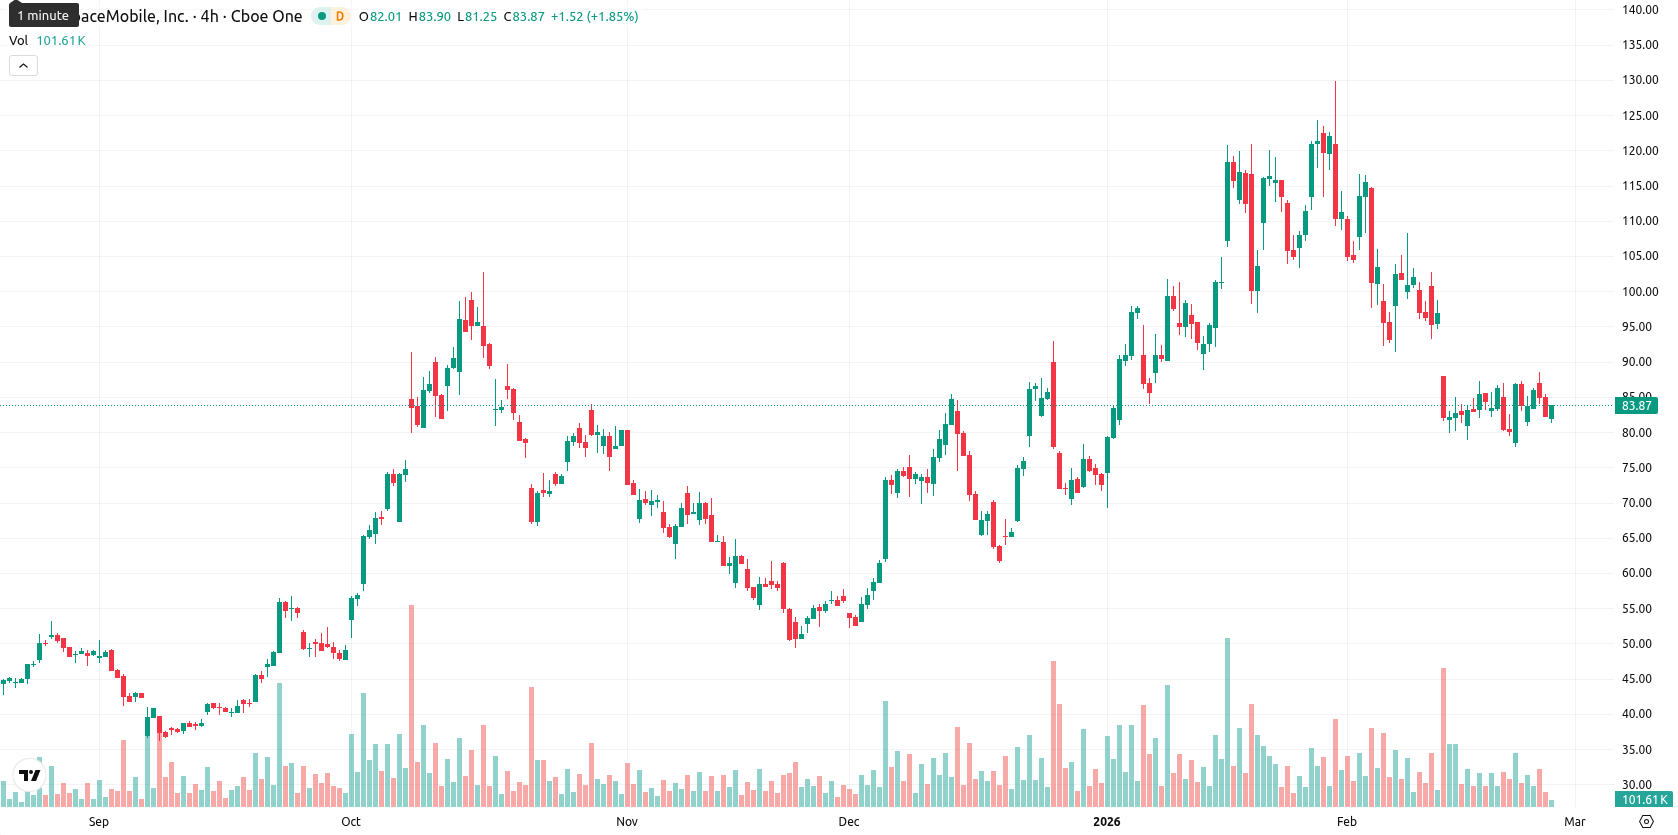
AST SpaceMobile (ASTS) is trading at $85.10, below the MA-20 at $95.98 and MA-50 at $91.76, but well above the MA-200 at $62.27. This setup signals short- and medium-term downward pressure, while the long-term trend remains supportive; the Ichimoku Kijun at $103.76 stands as immediate resistance.
Highlights
- AST SpaceMobile secured its first $30 million government contract with the Space Development Agency, signaling increased U.S. government engagement.
- The company signed a 10-year commercial agreement with Saudi Telecom Company to expand direct-to-device satellite broadband in remote regions and continues building global telecom partnerships.
- ASTS trades at $85.10, under short- and medium-term moving averages but well above its MA-200 of $62.27, with immediate resistance at the Ichimoku Kijun level of $103.76.
Government contract and global deals accelerate expansion pace
AST SpaceMobile recently announced its first $30 million contract with the Space Development Agency, marking a significant step in its government engagement. The company has also entered a 10-year commercial agreement with Saudi Telecom Company to expand direct-to-device satellite broadband services for remote regions, and is actively building out partnerships with global telecom operators. Expansion of its satellite communications portfolio continues, and its next earnings report is scheduled for March 2, 2026.
Oversold signals persist as downside momentum loses conviction
MACD and ADX on the daily chart both point to weak downside momentum, with MACD signaling "Sell" and a neutral ADX reading. RSI, Stochastic RSI, and CCI indicate mild oversold conditions, but the Bull/Bear Power shows sellers are still dominant. The last traded price is up 3.33% on the day, with no meaningful gap at the open, and currently sits near the session highs, reflecting moderate intraday volatility and some strength toward the top of today’s range. Oscillators reveal a divergence, with some oversold readings but persistent seller pressure, so intraday recovery is not yet fully confirmed by momentum indicators.
Bullish bias rises as price expected to hold volatility band
Over the next five trading days, ASTS is expected to fluctuate within the $81.00 to $89.00 volatility band relative to current levels. The probability of a price increase is high (over 80%), with three out of four weekly signals flashing bullish, and the probability of a decline is very low. The base expectation is for sideways movement within this $8-wide band. For a breakout, a move above the Ichimoku Kijun at $103.76 would open the path to higher resistance, while a close below $81.00 could expose further downside toward MA-100 levels.
Previously it was reported that AST SpaceMobile Inc. is exhibiting bearish momentum, with the price trading below its 20- and 50-day moving averages but maintaining support above the 200-day average. Momentum indicators, including a negative MACD and a neutral-to-oversold RSI of 44.9, reflect ongoing selling pressure and weak trend strength, while longer-term technicals signal underlying support.


Latest AST SpaceMobile News


-
 Afghanistan
-
 Albania
-
 Algeria
-
 Angola
-
 Argentina
-
 Armenia
-
 Australia
-
 Austria
-
 Azerbaijan
-
 Bahamas
-
 Bahrain
-
 Bangladesh
-
 Belarus
-
 Belgium
-
 Bolivia
-
 Botswana
-
 Brazil
-
 Brunei
-
 Bulgaria
-
 Cambodia
-
 Cameroon
-
 Canada
-
 Chile
Chile
-
 China
China
-
 Colombia
-
 Congo
Congo
-
 Costa Rica
-
 Cote d'Ivoire
-
 Croatia
-
 Cuba
Cuba
-
 Cyprus
-
 Czechia
-
 DR Congo
-
 Denmark
-
 Dominican Republic
-
 Ecuador
-
 Egypt
Egypt
-
 El Salvador
-
 Estonia
-
 Eswatini
-
 Ethiopia
-
 Finland
-
 France
-
 Georgia
-
 Germany
-
 Ghana
Ghana
-
 Greece
-
 Haiti
Haiti
-
 Hong Kong
-
 Hungary
-
 India
India
-
 Indonesia
-
 Iran, Islamic republic
-
 Iraq
Iraq
-
 Ireland
-
 Israel
-
 Italy
Italy
-
 Jamaica
-
 Japan
Japan
-
 Jordan
-
 Kazakhstan
-
 Kenya
Kenya
-
 Korea
Korea
-
 Kuwait
-
 Kyrgyzstan
-
 Laos
Laos
-
 Latvia
-
 Lebanon
-
 Lesotho
-
 Libya
Libya
-
 Lithuania
-
 Luxembourg
-
 Madagascar
-
 Malaysia
-
 Malta
Malta
-
 Mauritius
-
 Mexico
-
 Moldova
-
 Mongolia
-
 Montenegro
-
 Morocco
-
 Mozambique
-
 Myanmar
-
 Namibia
-
 Nepal
Nepal
-
 Netherlands
-
 New Zealand
-
 Nigeria
-
 North Macedonia
-
 Norway
-
 Oman
Oman
-
 Pakistan
-
 Palestine
-
 Panama
-
 Papua New Guinea
-
 Paraguay
-
 Peru
Peru
-
 Philippines
-
 Poland
-
 Portugal
-
 Puerto Rico
-
 Qatar
Qatar
-
 Reunion
-
 Romania
-
 Rwanda
-
 Saudi Arabia
-
 Serbia
-
 Singapore
-
 Slovakia
-
 Slovenia
-
 Somalia
-
 South Africa
-
 Spain
Spain
-
 Sri Lanka
-
 Sweden
-
 Switzerland
-
 Syria
Syria
-
 Taiwan
-
 Tajikistan
-
 Tanzania
-
 Thailand
-
 Trinidad and Tobago
-
 Tunisia
-
 Turkey
-
 UAE
UAE
-
 Uganda
-
 Ukraine
-
 United Kingdom
-
United States
-
 Uruguay
-
 Uzbekistan
-
 Venezuela
-
 Vietnam
-
 Yemen
Yemen
-
 Zambia
-
 Zimbabwe
- Forex
- Crypto
