
Quantum Computing stock: Earnings beat and M&A expansion fuel a daily gain against bearish signals

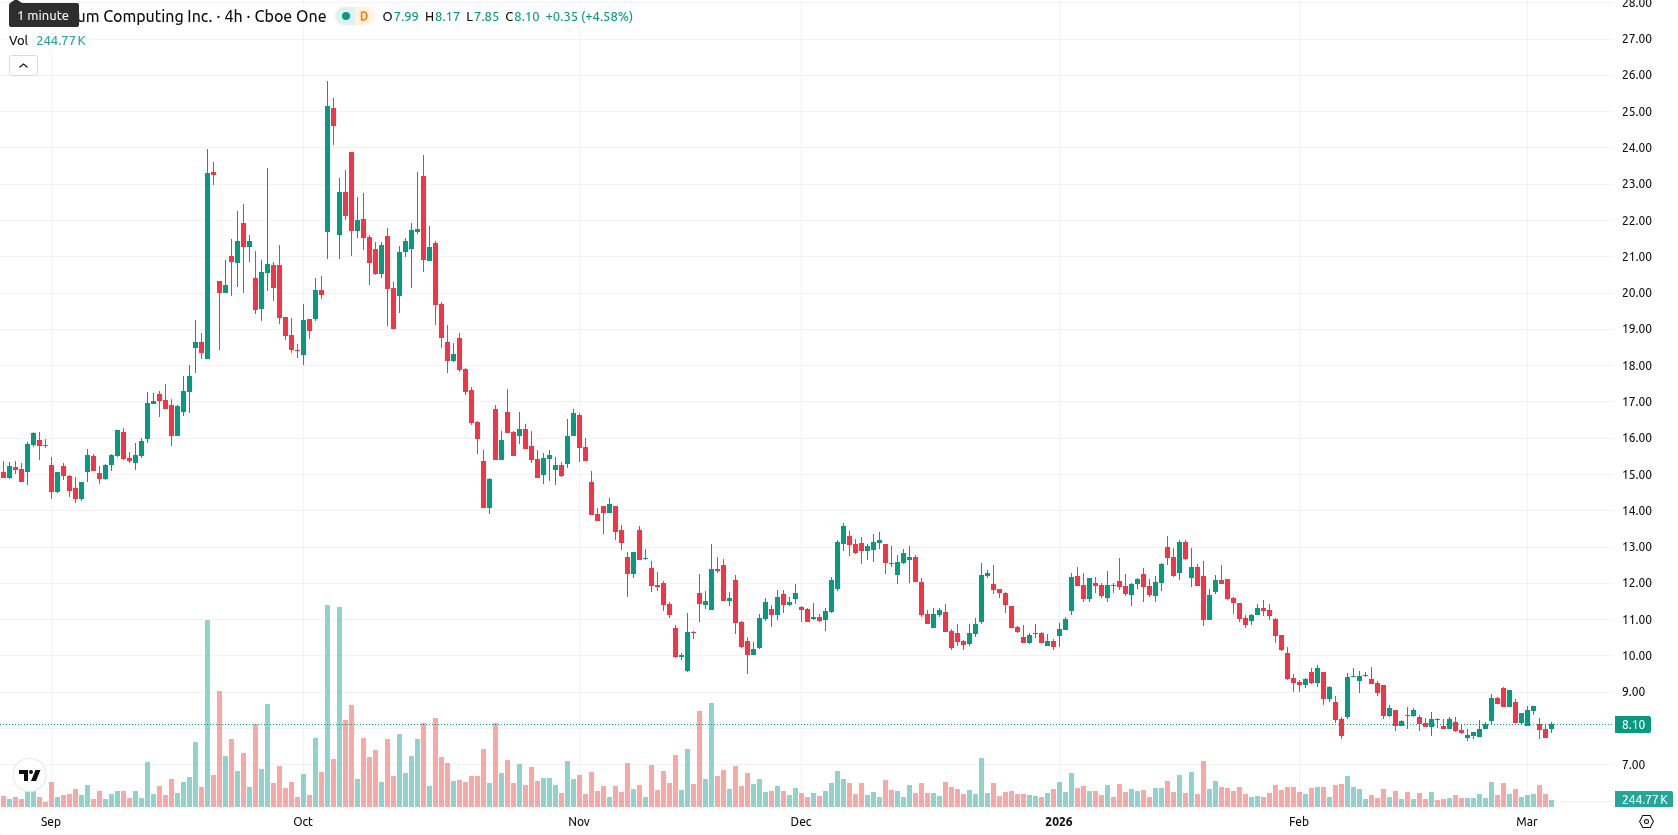
Quantum Computing Inc. (QUBT) is trading at $8.05 after a daily gain of 4.12%. The current price remains below the MA-20 ($8.52), MA-50 ($10.19), and MA-200 ($14.40), indicating persistent short-, medium-, and long-term selling pressure.
Highlights
- Quantum Computing Inc.'s Q4 2025 revenue surged to $198,000, while net loss narrowed sharply year over year.
- Strategic actions included expanded hiring, a major acquisition, a capital raise, and the launch of a photonic chip facility.
- The stock trades below key technical averages, with indicators signaling bearish momentum and a likely $7.25–$8.80 range in the near term.
Revenue surge and cost growth as expansion and M&A reshape outlook
On March 2, Quantum Computing Inc. released its fourth-quarter and full-year 2025 financial results, showing a sharp increase in fourth-quarter revenue to approximately $198,000 and a significantly reduced net loss for the year. Operating expenses rose to $22.1 million, reflecting expanded hiring and expenses related to mergers and acquisitions. The year was marked by notable milestones, including the opening of a thin-film lithium niobate photonic chip facility, initial foundry-services revenue, a major capital raise, and the acquisition of Lumina Semiconductor Inc. Ongoing progress was reported in quantum authentication, networking, and solutions for both government and commercial customers.
Bearish momentum persists as indicators diverge amid intraday volatility
The current price of $8.05 remains below the MA-20 ($8.52), MA-50 ($10.19), and MA-200 ($14.40), signaling persistent short-, medium-, and long-term selling pressure. The Ichimoku Kijun stands at $9.58, which is above the price and therefore represents immediate resistance. Momentum on the daily timeframe is negative, with both the MACD and ADX signaling weak trends and additional downside risk. RSI and Commodity Channel Index remain in bearish territory, indicating the market is not yet oversold, while the Stochastic RSI shows mixed signals between neutral and marginally oversold conditions. Bull/Bear Power points to a dominant seller presence intraday, and despite today's 4.12% gain and a small gap up at the open, the price is trading mid-range between $8.01 and $8.16. Intraday volatility is moderate, with price action showing some initial strength but settling sideways as indicators diverge and fail to confirm bullish momentum.
Downside risk outweighs upside as price struggles below key resistance
For the next 5 trading days, the expected price range is $7.25 – $8.80, reflecting a typical volatility band relative to current levels. The probability of an upward move is very low at less than 20%, while further downside remains the more likely scenario. The base case calls for continued sideways movement near current prices, with a potential bullish turnaround only if $9.58 resistance is cleared. Conversely, a break below the $7.25 support level could lead to accelerated declines.
Last time, analysts noted that Quantum Computing Inc. continued to trade below its short-, medium-, and long-term moving averages, with persistent bearish momentum across daily and weekly indicators including the MACD and ADX, as well as mild oversold signals from RSI and CCI. Immediate resistance remains near the Ichimoku Kijun level, while ongoing selling pressure and weak trend strength suggest low odds of a short-term rebound, keeping downside risks elevated.


Latest Quantum Computing News


-
 Afghanistan
-
 Albania
-
 Algeria
-
 Angola
-
 Argentina
-
 Armenia
-
 Australia
-
 Austria
-
 Azerbaijan
-
 Bahamas
-
 Bahrain
-
 Bangladesh
-
 Belarus
-
 Belgium
-
 Bolivia
-
 Botswana
-
 Brazil
-
 Brunei
-
 Bulgaria
-
 Cambodia
-
 Cameroon
-
 Canada
-
 Chile
Chile
-
 China
China
-
 Colombia
-
 Congo
Congo
-
 Costa Rica
-
 Cote d'Ivoire
-
 Croatia
-
 Cuba
Cuba
-
 Cyprus
-
 Czechia
-
 DR Congo
-
 Denmark
-
 Dominican Republic
-
 Ecuador
-
 Egypt
Egypt
-
 El Salvador
-
 Estonia
-
 Eswatini
-
 Ethiopia
-
 Finland
-
 France
-
 Georgia
-
 Germany
-
 Ghana
Ghana
-
 Greece
-
 Haiti
Haiti
-
 Hong Kong
-
 Hungary
-
 India
India
-
 Indonesia
-
 Iran, Islamic republic
-
 Iraq
Iraq
-
 Ireland
-
 Israel
-
 Italy
Italy
-
 Jamaica
-
 Japan
Japan
-
 Jordan
-
 Kazakhstan
-
 Kenya
Kenya
-
 Korea
Korea
-
 Kuwait
-
 Kyrgyzstan
-
 Laos
Laos
-
 Latvia
-
 Lebanon
-
 Lesotho
-
 Libya
Libya
-
 Lithuania
-
 Luxembourg
-
 Madagascar
-
 Malaysia
-
 Malta
Malta
-
 Mauritius
-
 Mexico
-
 Moldova
-
 Mongolia
-
 Montenegro
-
 Morocco
-
 Mozambique
-
 Myanmar
-
 Namibia
-
 Nepal
Nepal
-
 Netherlands
-
 New Zealand
-
 Nigeria
-
 North Macedonia
-
 Norway
-
 Oman
Oman
-
 Pakistan
-
 Palestine
-
 Panama
-
 Papua New Guinea
-
 Paraguay
-
 Peru
Peru
-
 Philippines
-
 Poland
-
 Portugal
-
 Puerto Rico
-
 Qatar
Qatar
-
 Reunion
-
 Romania
-
 Rwanda
-
 Saudi Arabia
-
 Serbia
-
 Singapore
-
 Slovakia
-
 Slovenia
-
 Somalia
-
 South Africa
-
 Spain
Spain
-
 Sri Lanka
-
 Sweden
-
 Switzerland
-
 Syria
Syria
-
 Taiwan
-
 Tajikistan
-
 Tanzania
-
 Thailand
-
 Trinidad and Tobago
-
 Tunisia
-
 Turkey
-
 UAE
UAE
-
 Uganda
-
 Ukraine
-
 United Kingdom
-
United States
-
 Uruguay
-
 Uzbekistan
-
 Venezuela
-
 Vietnam
-
 Yemen
Yemen
-
 Zambia
-
 Zimbabwe
- Forex
- Crypto
