
Canopy Growth stock: Mixed momentum indicators drive renewed 3.24% decline

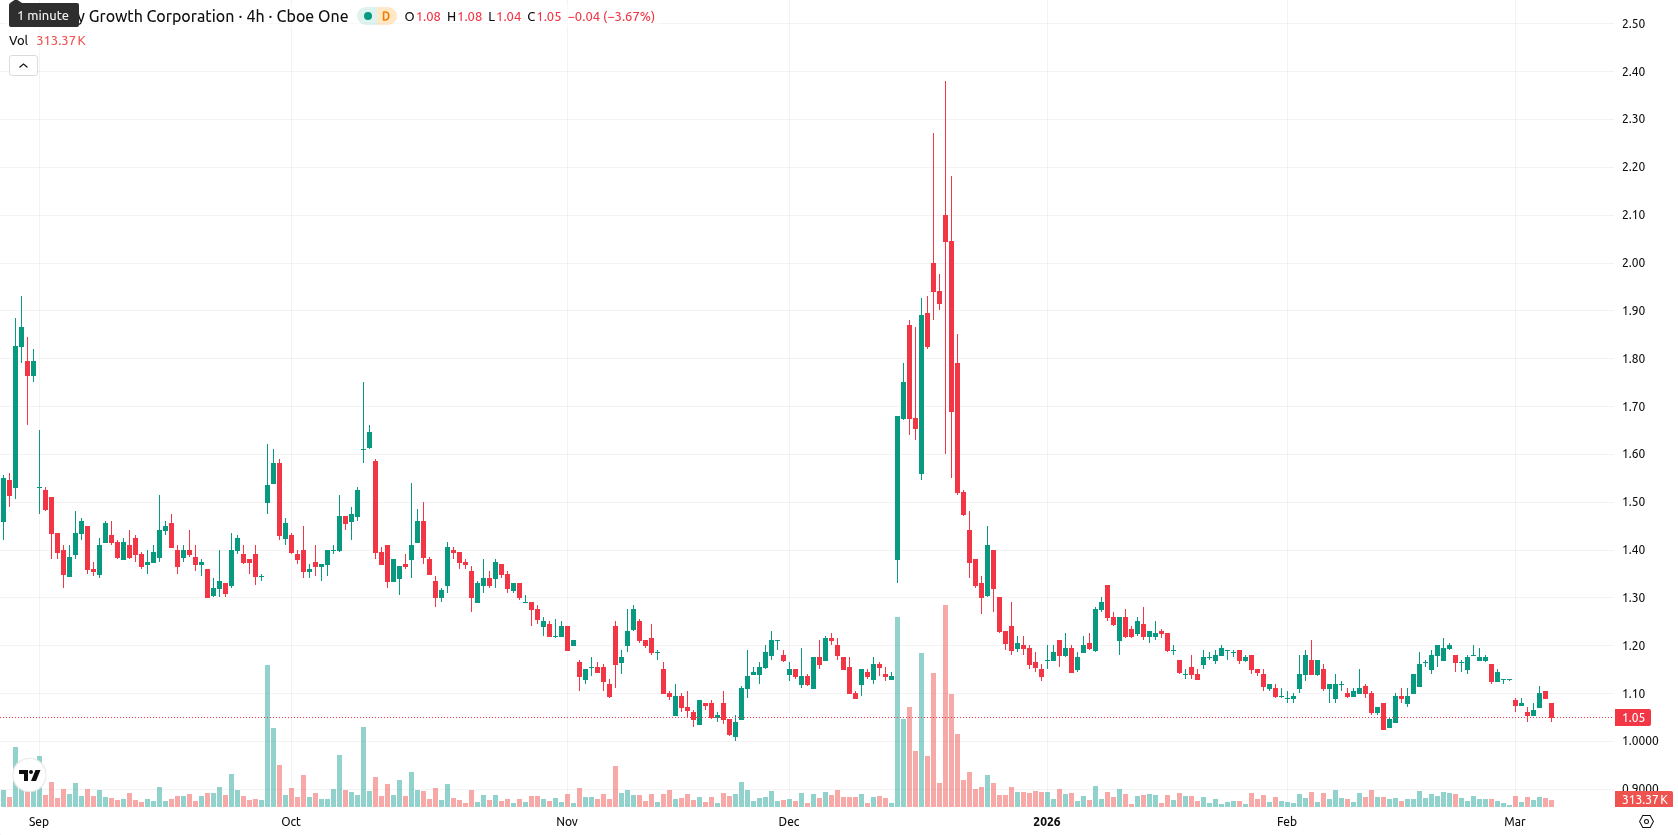
Canopy Growth Corporation (CGC) is trading at $1.05 after a daily decline of 3.24%, positioning the price below its MA-20 ($1.11), MA-50 ($1.17), and MA-200 ($1.29) levels. This suggests persistent downside pressure against key moving averages.
Highlights
- Price remains below short-, medium-, and long-term moving averages, reinforcing a bearish market structure.
- Momentum and oscillator signals diverge, showing sustained bearish pressure but flagging near-term oversold conditions and potential stabilization.
- Key support is at $1.03 and resistance at $1.09, with the next five-day range projected between these levels and low probability of an upside breakout.
Mixed oversold signals as bearish momentum persists
The current price of $1.05 is positioned below the MA-20 ($1.11), MA-50 ($1.17), and MA-200 ($1.29) levels, indicating that short-, medium-, and long-term trends remain under pressure from sellers. The Ichimoku Kijun level is $1.12, which acts as immediate resistance above the market. Momentum indicators on the daily chart, including MACD and ADX, continue to show weak bearish momentum and trend strength. RSI stands at 43.08 with a “Sell” signal, while both the Commodity Channel Index and Stochastic RSI flag pockets of oversold conditions, highlighting potential for near-term stabilization. Bull/Bear Power direction is “Buy” but near flat, suggesting neither side has a strong intraday grip, while the Awesome Oscillator confirms a bearish tone. The price declined 3.24% on the day with no gap between the previous close and today's open. The price currently sits near the low end of today’s range ($1.04-$1.08), reflecting low intraday volatility and continued pressure after the open. Notably, there is divergence among oscillators and momentum indicators, as some highlight oversold conditions while the broader momentum signals remain negative. This mix suggests potential for short-term stabilization but with persistent bearish bias.
Bearish scenario likely as volatility bands tighten
For the next five trading days, the expected price range is adjusted to $1.03 to $1.09, encompassing recent lows and a typical volatility band relative to current levels. Based on weekly signals, the probability of upward movement is very low (less than 20%), making further downside more likely. In the baseline scenario, the price remains trapped in a sideways corridor between support at $1.03 and resistance near $1.09. A bullish scenario would require a move above $1.12 to clear immediate resistance, opening potential for recovery, while a break below $1.03 would signal renewed weakness and risk deeper declines in the short term.
Last time, analysts noted that Canopy Growth Corporation continued to trade below its key moving averages, reflecting ongoing selling pressure and a bearish technical posture. Despite oversold signals from RSI and Stoch RSI, momentum indicators such as MACD and ADX remain weak, with support appearing fragile near current levels and resistance outlined at $1.12.


Latest Canopy Growth News


-
 Afghanistan
-
 Albania
-
 Algeria
-
 Angola
-
 Argentina
-
 Armenia
-
 Australia
-
 Austria
-
 Azerbaijan
-
 Bahamas
-
 Bahrain
-
 Bangladesh
-
 Belarus
-
 Belgium
-
 Bolivia
-
 Botswana
-
 Brazil
-
 Brunei
-
 Bulgaria
-
 Cambodia
-
 Cameroon
-
 Canada
-
 Chile
Chile
-
 China
China
-
 Colombia
-
 Congo
Congo
-
 Costa Rica
-
 Cote d'Ivoire
-
 Croatia
-
 Cuba
Cuba
-
 Cyprus
-
 Czechia
-
 DR Congo
-
 Denmark
-
 Dominican Republic
-
 Ecuador
-
 Egypt
Egypt
-
 El Salvador
-
 Estonia
-
 Eswatini
-
 Ethiopia
-
 Finland
-
 France
-
 Georgia
-
 Germany
-
 Ghana
Ghana
-
 Greece
-
 Haiti
Haiti
-
 Hong Kong
-
 Hungary
-
 India
India
-
 Indonesia
-
 Iran, Islamic republic
-
 Iraq
Iraq
-
 Ireland
-
 Israel
-
 Italy
Italy
-
 Jamaica
-
 Japan
Japan
-
 Jordan
-
 Kazakhstan
-
 Kenya
Kenya
-
 Korea
Korea
-
 Kuwait
-
 Kyrgyzstan
-
 Laos
Laos
-
 Latvia
-
 Lebanon
-
 Lesotho
-
 Libya
Libya
-
 Lithuania
-
 Luxembourg
-
 Madagascar
-
 Malaysia
-
 Malta
Malta
-
 Mauritius
-
 Mexico
-
 Moldova
-
 Mongolia
-
 Montenegro
-
 Morocco
-
 Mozambique
-
 Myanmar
-
 Namibia
-
 Nepal
Nepal
-
 Netherlands
-
 New Zealand
-
 Nigeria
-
 North Macedonia
-
 Norway
-
 Oman
Oman
-
 Pakistan
-
 Palestine
-
 Panama
-
 Papua New Guinea
-
 Paraguay
-
 Peru
Peru
-
 Philippines
-
 Poland
-
 Portugal
-
 Puerto Rico
-
 Qatar
Qatar
-
 Reunion
-
 Romania
-
 Rwanda
-
 Saudi Arabia
-
 Serbia
-
 Singapore
-
 Slovakia
-
 Slovenia
-
 Somalia
-
 South Africa
-
 Spain
Spain
-
 Sri Lanka
-
 Sweden
-
 Switzerland
-
 Syria
Syria
-
 Taiwan
-
 Tajikistan
-
 Tanzania
-
 Thailand
-
 Trinidad and Tobago
-
 Tunisia
-
 Turkey
-
 UAE
UAE
-
 Uganda
-
 Ukraine
-
 United Kingdom
-
United States
-
 Uruguay
-
 Uzbekistan
-
 Venezuela
-
 Vietnam
-
 Yemen
Yemen
-
 Zambia
-
 Zimbabwe
- Forex
- Crypto
