
Meta stock: Negative momentum and failed moving averages drive decline

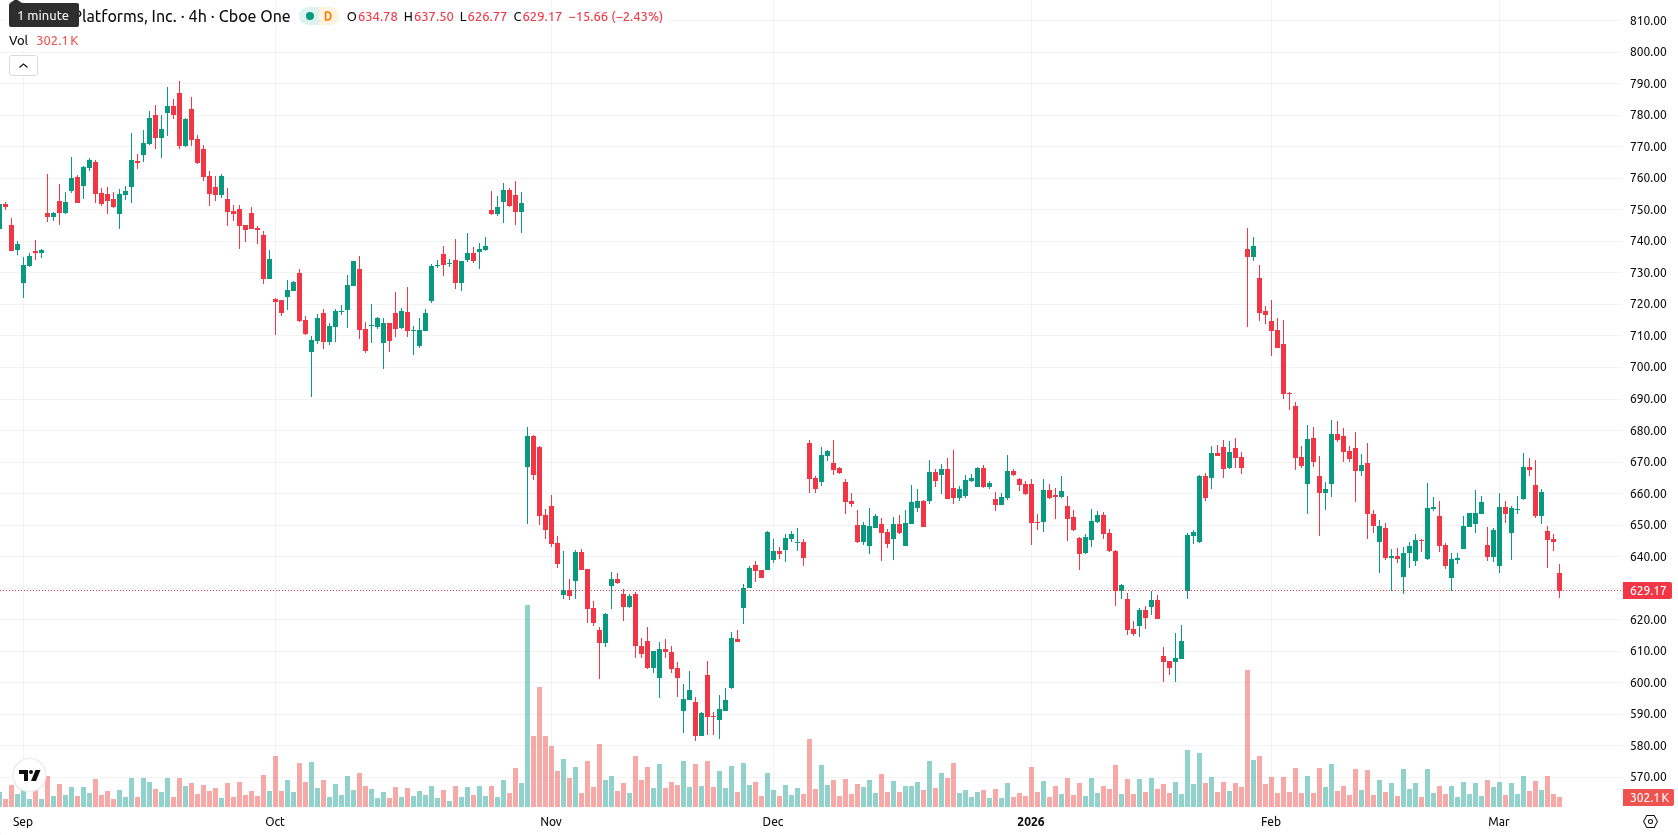
Meta Platforms, Inc. (META, formerly Facebook, Inc.) is trading at $628.93, down 2.42% on the day. The price is well below the MA-20 ($653.37), MA-50 ($656.52), and MA-200 ($691.51), indicating sustained downward pressure across all major timeframes.
 625.19
628.28
625.19
628.28
Highlights
- META's share price is under persistent pressure, trading well below key short-, medium-, and long-term moving averages.
- Momentum signals remain negative, with major oscillators and trend strength indicators showing seller control and oversold intraday conditions.
- META is expected to consolidate between $610 and $645 over the next five sessions, with a high probability of further downside risk.
Negative momentum and oversold signals as sellers maintain control
Momentum readings for META are negative, with the MACD on both daily and weekly timeframes signaling persistent selling pressure. The ADX indicates low trend strength, and both the RSI and Commodity Channel Index remain in a sell zone. Intraday readings from the Stochastic RSI and Bull/Bear Power highlight oversold conditions and continued seller dominance. The price opened with a slight gap down and has approached the lower end of the current $627.12 – $636.62 range, mirroring high volatility and intraday selling. The Ichimoku Kijun stands at $686.08, serving as immediate resistance. The Awesome Oscillator is neutral and does not reinforce the broader bearish tilt.
Downside risk favored as volatility persists and resistance holds
Over the next five sessions, META is expected to fluctuate within a volatility band between $610 and $645. The likelihood of a price increase is low (below 20%), so a further decline or extended consolidation is more probable. For any bullish reversal, a move through resistance near $686 would be required; failure to hold the low $610s as support could prompt additional downside risk.
Last time, analysts noted that Meta Platforms, Inc. is trading below its short-, medium-, and long-term moving averages, reflecting continued technical weakness and ongoing seller dominance despite conflicting momentum signals. Key technical indicators, including a bearish MACD, neutral RSI, and overbought readings from oscillators, suggest persistent intraday pressure with little evidence of a strong reversal attempt as the price hovers near recent lows.














-
 Afghanistan
-
 Albania
-
 Algeria
-
 Angola
-
 Argentina
-
 Armenia
-
 Australia
-
 Austria
-
 Azerbaijan
-
 Bahamas
-
 Bahrain
-
 Bangladesh
-
 Belarus
-
 Belgium
-
 Bolivia
-
 Botswana
-
 Brazil
-
 Brunei
-
 Bulgaria
-
 Cambodia
-
 Cameroon
-
 Canada
-
 Chile
Chile
-
 China
China
-
 Colombia
-
 Congo
Congo
-
 Costa Rica
-
 Cote d'Ivoire
-
 Croatia
-
 Cuba
Cuba
-
 Cyprus
-
 Czechia
-
 DR Congo
-
 Denmark
-
 Dominican Republic
-
 Ecuador
-
 Egypt
Egypt
-
 El Salvador
-
 Estonia
-
 Eswatini
-
 Ethiopia
-
 Finland
-
 France
-
 Georgia
-
 Germany
-
 Ghana
Ghana
-
 Greece
-
 Haiti
Haiti
-
 Hong Kong
-
 Hungary
-
 India
India
-
 Indonesia
-
 Iran, Islamic republic
-
 Iraq
Iraq
-
 Ireland
-
 Israel
-
 Italy
Italy
-
 Jamaica
-
 Japan
Japan
-
 Jordan
-
 Kazakhstan
-
 Kenya
Kenya
-
 Korea
Korea
-
 Kuwait
-
 Kyrgyzstan
-
 Laos
Laos
-
 Latvia
-
 Lebanon
-
 Lesotho
-
 Libya
Libya
-
 Lithuania
-
 Luxembourg
-
 Madagascar
-
 Malaysia
-
 Malta
Malta
-
 Mauritius
-
 Mexico
-
 Moldova
-
 Mongolia
-
 Montenegro
-
 Morocco
-
 Mozambique
-
 Myanmar
-
 Namibia
-
 Nepal
Nepal
-
 Netherlands
-
 New Zealand
-
 Nigeria
-
 North Macedonia
-
 Norway
-
 Oman
Oman
-
 Pakistan
-
 Palestine
-
 Panama
-
 Papua New Guinea
-
 Paraguay
-
 Peru
Peru
-
 Philippines
-
 Poland
-
 Portugal
-
 Puerto Rico
-
 Qatar
Qatar
-
 Reunion
-
 Romania
-
 Rwanda
-
 Saudi Arabia
-
 Serbia
-
 Singapore
-
 Slovakia
-
 Slovenia
-
 Somalia
-
 South Africa
-
 Spain
Spain
-
 Sri Lanka
-
 Sweden
-
 Switzerland
-
 Syria
Syria
-
 Taiwan
-
 Tajikistan
-
 Tanzania
-
 Thailand
-
 Trinidad and Tobago
-
 Tunisia
-
 Turkey
-
 UAE
UAE
-
 Uganda
-
 Ukraine
-
 United Kingdom
-
United States
-
 Uruguay
-
 Uzbekistan
-
 Venezuela
-
 Vietnam
-
 Yemen
Yemen
-
 Zambia
-
 Zimbabwe
- Forex
- Crypto











