
Microsoft stock price forecast: Bearish indicators persist as MSFT holds just above $405

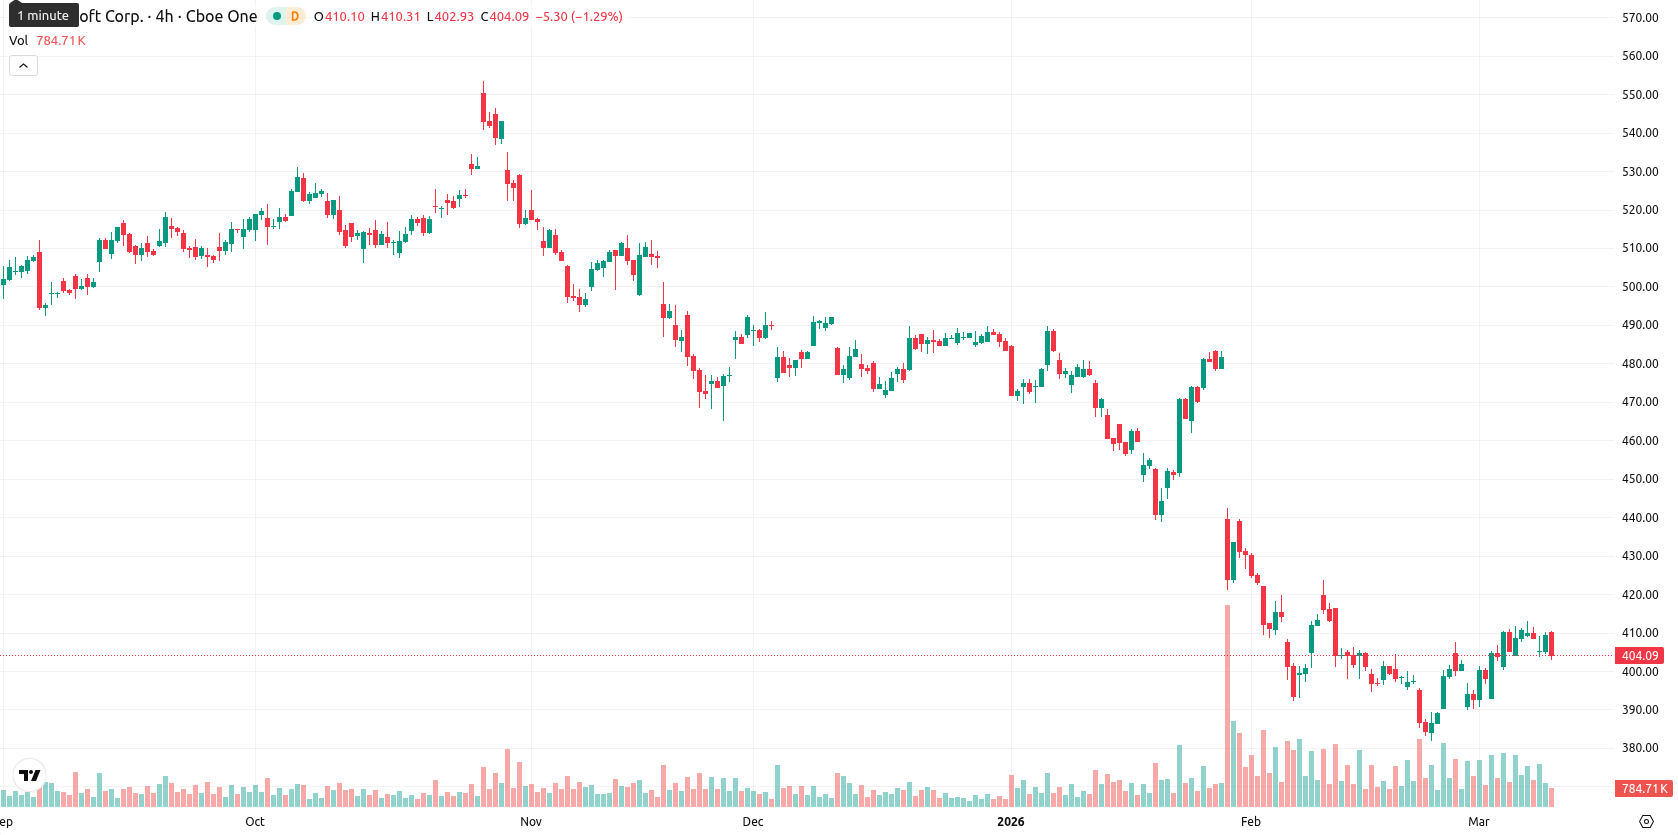
Microsoft Corporation (MSFT) is trading at $405.55 after a daily decline of 0.94%. The price sits above the SMA-20 ($401.56), while remaining below both the SMA-50 ($436.20) and SMA-200 ($484.30), signaling a short-term bullish tilt within a broader medium- and long-term bearish setting. Immediate resistance is identified at the Ichimoku Kijun level of $409.48.
Highlights
- Microsoft expanded enterprise AI offerings with Copilot Cowork and new 365 features, targeting higher-value business segments.
- The company signed an AI analytics partnership with Codelco and introduced the $99 per month Microsoft 365 E7 bundle.
- MSFT trades in a short-term uptrend but faces medium- and long-term bearish momentum, with consolidation likely between $400 and $410 amid overbought conditions and strong selling pressure.
AI suite expansion and insider selling amid persistent market pressure
On March 10, 2026, Microsoft expanded its artificial intelligence offerings by launching Copilot Cowork, developed with Anthropic, for enterprise Microsoft 365 users. The company also introduced new AI features across its productivity suite and made its Agent 365 governance solution available at $15 per user per month. Additionally, Microsoft announced the upcoming launch of the Microsoft 365 E7 workplace bundle priced at $99 per month and disclosed an agreement with Codelco on March 5, 2026, to collaborate on AI-driven analytics and automation in mining operations. Executive Vice President Kathleen T. Hogan sold 12,321 shares valued at $5 million, though price action has remained under broader selling pressure.
Bearish momentum persists as overbought signals counter key resistance
Technical signals for MSFT remain mixed. Although the current price is positioned above the SMA-20, it sits below both the SMA-50 and SMA-200, with immediate resistance marked by the Ichimoku Kijun at $409.48. Daily momentum indicators, including MACD and ADX, point to a bearish environment with 'Strong Sell' and 'Sell' signals respectively; RSI is at a neutral-sell reading of 47.65, Stoch RSI is highly overbought at 96.62, and CCI is positive at 72.17, highlighting a divergence between momentum and oscillators. BBP reads 'Overbought', dominated by buyers, while the Awesome Oscillator is neutral, suggesting that overbought conditions coexist with underlying bearish momentum.
Sideways trade expected as bearish momentum limits upside potential
Over the next five trading days, MSFT is expected to fluctuate within the $397 to $410 range, a volatility band relative to current levels. The likelihood of a price increase is low (less than 20%), making further declines more probable as bearish signals continue to dominate the weekly momentum profile. Baseline expectation is for sideways consolidation between $400 and $410 while recent overbought readings normalize. A breakout above $409.50 would require improved momentum and could initiate upside, whereas a fall below $400 may trigger heightened selling pressure if support does not hold.
Previously it was reported that Microsoft is trading just above its 20-day moving average but remains well below its 50- and 200-day averages, with technical indicators such as MACD and ADX reflecting ongoing bearish momentum while oscillators provide mixed signals. Immediate support is seen near $397–$401, resistance at $410–$412, and the near-term outlook favors continued downside pressure with limited probability of a sustained rebound excluding a breakout above immediate resistance.


Latest Microsoft News


-
 Afghanistan
-
 Albania
-
 Algeria
-
 Angola
-
 Argentina
-
 Armenia
-
 Australia
-
 Austria
-
 Azerbaijan
-
 Bahamas
-
 Bahrain
-
 Bangladesh
-
 Belarus
-
 Belgium
-
 Bolivia
-
 Botswana
-
 Brazil
-
 Brunei
-
 Bulgaria
-
 Cambodia
-
 Cameroon
-
 Canada
-
 Chile
Chile
-
 China
China
-
 Colombia
-
 Congo
Congo
-
 Costa Rica
-
 Cote d'Ivoire
-
 Croatia
-
 Cuba
Cuba
-
 Cyprus
-
 Czechia
-
 DR Congo
-
 Denmark
-
 Dominican Republic
-
 Ecuador
-
 Egypt
Egypt
-
 El Salvador
-
 Estonia
-
 Eswatini
-
 Ethiopia
-
 Finland
-
 France
-
 Georgia
-
 Germany
-
 Ghana
Ghana
-
 Greece
-
 Haiti
Haiti
-
 Hong Kong
-
 Hungary
-
 India
India
-
 Indonesia
-
 Iran, Islamic republic
-
 Iraq
Iraq
-
 Ireland
-
 Israel
-
 Italy
Italy
-
 Jamaica
-
 Japan
Japan
-
 Jordan
-
 Kazakhstan
-
 Kenya
Kenya
-
 Korea
Korea
-
 Kuwait
-
 Kyrgyzstan
-
 Laos
Laos
-
 Latvia
-
 Lebanon
-
 Lesotho
-
 Libya
Libya
-
 Lithuania
-
 Luxembourg
-
 Madagascar
-
 Malaysia
-
 Malta
Malta
-
 Mauritius
-
 Mexico
-
 Moldova
-
 Mongolia
-
 Montenegro
-
 Morocco
-
 Mozambique
-
 Myanmar
-
 Namibia
-
 Nepal
Nepal
-
 Netherlands
-
 New Zealand
-
 Nigeria
-
 North Macedonia
-
 Norway
-
 Oman
Oman
-
 Pakistan
-
 Palestine
-
 Panama
-
 Papua New Guinea
-
 Paraguay
-
 Peru
Peru
-
 Philippines
-
 Poland
-
 Portugal
-
 Puerto Rico
-
 Qatar
Qatar
-
 Reunion
-
 Romania
-
 Rwanda
-
 Saudi Arabia
-
 Serbia
-
 Singapore
-
 Slovakia
-
 Slovenia
-
 Somalia
-
 South Africa
-
 Spain
Spain
-
 Sri Lanka
-
 Sweden
-
 Switzerland
-
 Syria
Syria
-
 Taiwan
-
 Tajikistan
-
 Tanzania
-
 Thailand
-
 Trinidad and Tobago
-
 Tunisia
-
 Turkey
-
 UAE
UAE
-
 Uganda
-
 Ukraine
-
 United Kingdom
-
United States
-
 Uruguay
-
 Uzbekistan
-
 Venezuela
-
 Vietnam
-
 Yemen
Yemen
-
 Zambia
-
 Zimbabwe
- Forex
- Crypto
