
Robust earnings lift, but technicals signal caution — Microsoft stock consolidates

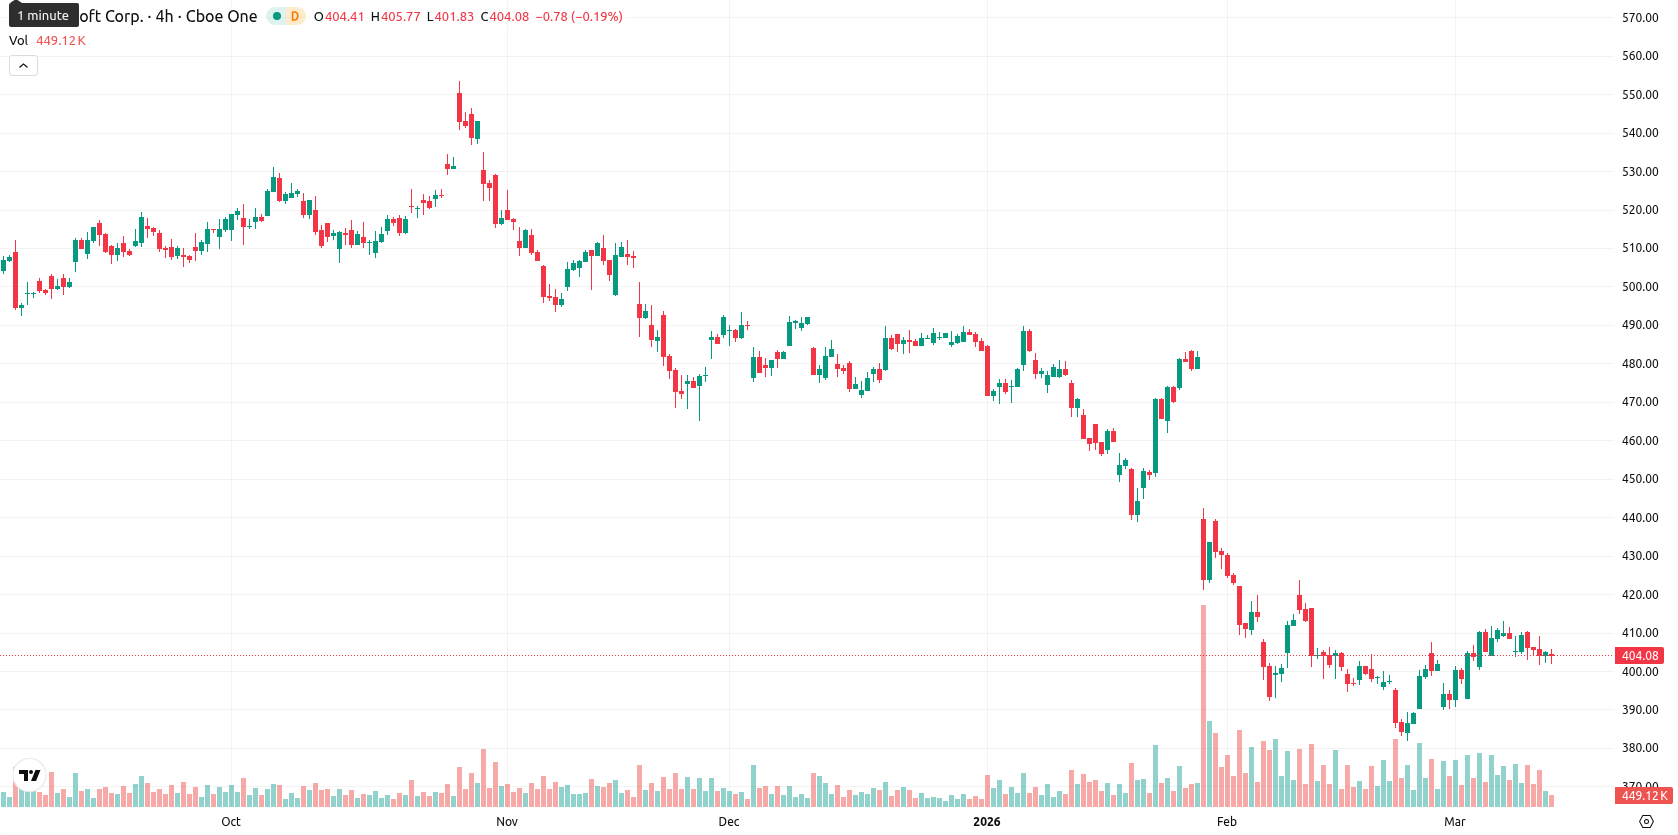
Microsoft Corporation (MSFT) is trading at $403.77, showing a daily decline of 0.24%. The price sits just above the SMA-20 ($400.75), while remaining well below the SMA-50 ($432.90) and SMA-200 ($483.82), indicating mild short-term support but prevailing medium- and long-term downward pressure.
Highlights
- Microsoft posted 24% year-over-year EPS growth to $4.14 on $81.27 billion in revenue, driving a 47% operating margin in Q2 2026.
- Shareholder returns climbed 32% to $12.7 billion, with a $0.91 dividend set for June 11 and Anthropic partnership integration underway.
- Technicals show shares consolidating near $400, with bearish trends and downside favored unless $402.70 resistance is reclaimed; near-term range is $398.44–$411.04.
Mixed fundamentals and partnerships offset by sustained stock pressure
For the fiscal second quarter of 2026, Microsoft reported non-GAAP diluted earnings per share of $4.14, up 24% year over year, on revenue of $81.27 billion and operating income of $38.3 billion, bringing the operating margin to 47%. The company returned $12.7 billion to shareholders through dividends and share repurchases during the quarter, a 32% year-over-year increase. A quarterly dividend of $0.91 per share was also announced, payable on June 11, 2026. Microsoft entered into a partnership with Anthropic to integrate its Claude Cowork chatbot into Microsoft 365 and Copilot programs, though price action has remained under broader selling pressure.
Momentum divergence as sellers clash with buyer exhaustion
Short-term technicals show MSFT trading above the SMA-20 ($400.75), with immediate resistance at the Ichimoku Kijun ($402.70), while medium- and long-term trends are under seller pressure below the SMA-50 ($432.90) and SMA-200 ($483.82). MACD signals a strong sell, ADX indicates a directional sell bias, and BBP's overbought reading points to recent buyer dominance and possible exhaustion. Stoch RSI is overbought, while both RSI (44.61) and CCI (58.24) are neutral to slightly bearish; the Awesome Oscillator is neutral, suggesting a divergence among oscillators. The price is consolidating near the midpoint of today's range ($401.85 – $405.40), with moderate volatility after a subdued open.
Constrained sideways trade expected as bearish signals persist
In the short term, MSFT is likely to remain within a typical volatility band between $398.44 and $411.04 over the next five sessions. The probability of further upside is limited (less than 20%), as all major weekly technical signals (MA-50, RSI, ADX, MACD) lean bearish. The baseline scenario expects prices to remain in a sideways corridor near current levels. A break above $402.70 would be needed to shift momentum upward, while movement below $398.44 could confirm renewed downside.
Previously it was reported that Microsoft shares are showing short-term stabilization just above the 20-day SMA, though they remain well below the 50- and 200-day averages, reflecting persistent medium- and long-term downside pressure. Technical indicators, including a bearish MACD and elevated ADX, confirm ongoing negative momentum, with support near $402.70 and a low probability of a near-term rebound as selling pressure persists within the $398–$411 trading band.


Latest Microsoft News


-
 Afghanistan
-
 Albania
-
 Algeria
-
 Angola
-
 Argentina
-
 Armenia
-
 Australia
-
 Austria
-
 Azerbaijan
-
 Bahamas
-
 Bahrain
-
 Bangladesh
-
 Belarus
-
 Belgium
-
 Bolivia
-
 Botswana
-
 Brazil
-
 Brunei
-
 Bulgaria
-
 Cambodia
-
 Cameroon
-
 Canada
-
 Chile
Chile
-
 China
China
-
 Colombia
-
 Congo
Congo
-
 Costa Rica
-
 Cote d'Ivoire
-
 Croatia
-
 Cuba
Cuba
-
 Cyprus
-
 Czechia
-
 DR Congo
-
 Denmark
-
 Dominican Republic
-
 Ecuador
-
 Egypt
Egypt
-
 El Salvador
-
 Estonia
-
 Eswatini
-
 Ethiopia
-
 Finland
-
 France
-
 Georgia
-
 Germany
-
 Ghana
Ghana
-
 Greece
-
 Haiti
Haiti
-
 Hong Kong
-
 Hungary
-
 India
India
-
 Indonesia
-
 Iran, Islamic republic
-
 Iraq
Iraq
-
 Ireland
-
 Israel
-
 Italy
Italy
-
 Jamaica
-
 Japan
Japan
-
 Jordan
-
 Kazakhstan
-
 Kenya
Kenya
-
 Korea
Korea
-
 Kuwait
-
 Kyrgyzstan
-
 Laos
Laos
-
 Latvia
-
 Lebanon
-
 Lesotho
-
 Libya
Libya
-
 Lithuania
-
 Luxembourg
-
 Madagascar
-
 Malaysia
-
 Malta
Malta
-
 Mauritius
-
 Mexico
-
 Moldova
-
 Mongolia
-
 Montenegro
-
 Morocco
-
 Mozambique
-
 Myanmar
-
 Namibia
-
 Nepal
Nepal
-
 Netherlands
-
 New Zealand
-
 Nigeria
-
 North Macedonia
-
 Norway
-
 Oman
Oman
-
 Pakistan
-
 Palestine
-
 Panama
-
 Papua New Guinea
-
 Paraguay
-
 Peru
Peru
-
 Philippines
-
 Poland
-
 Portugal
-
 Puerto Rico
-
 Qatar
Qatar
-
 Reunion
-
 Romania
-
 Rwanda
-
 Saudi Arabia
-
 Serbia
-
 Singapore
-
 Slovakia
-
 Slovenia
-
 Somalia
-
 South Africa
-
 Spain
Spain
-
 Sri Lanka
-
 Sweden
-
 Switzerland
-
 Syria
Syria
-
 Taiwan
-
 Tajikistan
-
 Tanzania
-
 Thailand
-
 Trinidad and Tobago
-
 Tunisia
-
 Turkey
-
 UAE
UAE
-
 Uganda
-
 Ukraine
-
 United Kingdom
-
United States
-
 Uruguay
-
 Uzbekistan
-
 Venezuela
-
 Vietnam
-
 Yemen
Yemen
-
 Zambia
-
 Zimbabwe
- Forex
- Crypto
