
Palantir stock: Strong AI moves fuel a 2.06% rise amid mixed technical outlook

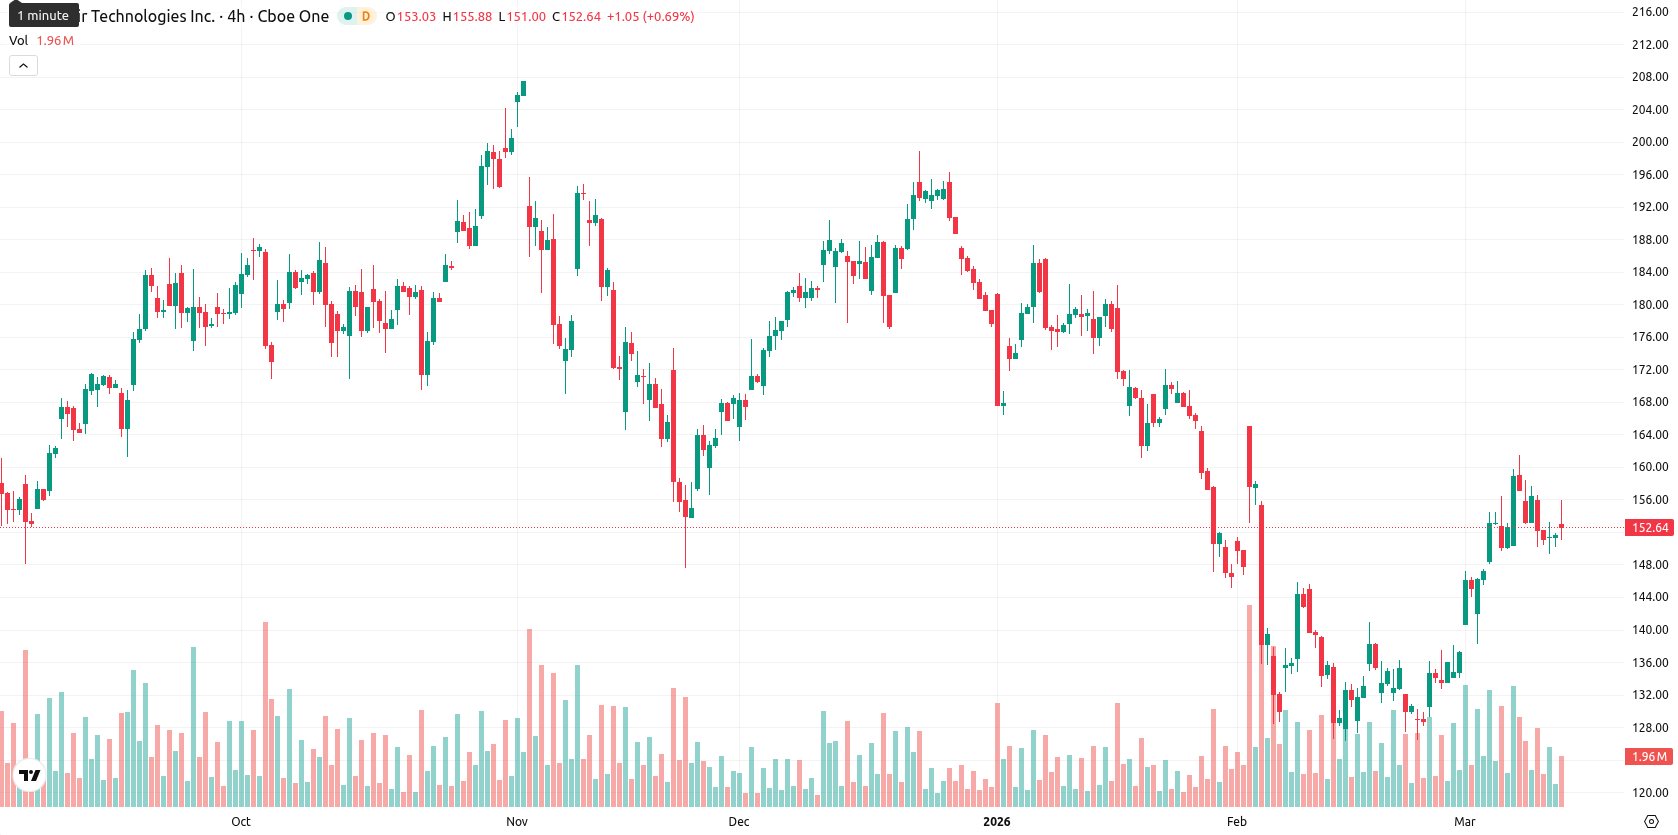
Palantir Technologies Inc (PLTR) is trading at $154.73, posting a daily gain of 2.06%. The price sits above the SMA-20 ($140.80), just below the SMA-50 ($155.06), and well under the SMA-200 ($162.52), indicating a short-term bullish bias with medium-term indecision and ongoing long-term resistance.
Highlights
- Palantir showcased broad sector adoption of its AI platform at AIPCon and expanded a key partnership with Nvidia for AI data center solutions.
- The company extended its multi-year GE Aerospace collaboration for military aviation and gained rapid deployment clearance from the Defense Information Systems Agency.
- Technicals show PLTR faces strong long-term resistance with mixed momentum signals, and is likely to consolidate between $148.00 and $158.50 short term.
Broadened AI partnerships as enterprise and government demand rises
Palantir has hosted its ninth AIPCon conference, highlighting the adoption of its Artificial Intelligence Platform across sectors including defense, aerospace, finance, healthcare, and government. The company expanded its partnership with Nvidia to introduce a sovereign AI operating system reference architecture, offering integrated AI data center solutions for enterprise and government clients. Palantir also extended a multi-year agreement with GE Aerospace to enhance military aviation readiness through its AI platform, and received authorization from the Defense Information Systems Agency for its Federal Cloud Service, enabling rapid deployment of workloads for U.S. government customers.
Mixed momentum and overbought signals as intraday buyers persist
Technically, the Ichimoku Kijun sits at $145.72, acting as immediate support below the current price. Momentum indicators are mixed: the daily MACD is neutral, ADX shows weak trend strength, RSI and CCI remain in buying territory, while Stoch RSI hovers near overbought and BBP signals intraday buyer dominance. The Awesome Oscillator confirms bullish intraday momentum, and volatility is moderately high, with a strong opening gap and price staying near session highs. However, oscillator divergence as they approach overbought, with neutral trend momentum, signals a note of caution.
Sideways range favored as weekly indicators flag persistent bearish risk
For the next 5 sessions, the anticipated price range spans $148.00 to $158.50, reflecting typical volatility. The likelihood of a further upward move is low (less than 20%), as bearish signals persist on the weekly RSI, ADX, and MACD. A sideways consolidation around the current price is the baseline scenario, with a bullish breakout requiring a decisive move above immediate resistance, while a drop below $148.00 would point to a bearish turn.
Recently it was reported that Palantir Technologies Inc is trading above its short-term moving average but remains below its 50- and 200-day averages, signaling ongoing medium- and long-term bearish pressure despite some short-term support. Momentum indicators are mixed—while RSI and CCI show mild bullish bias and overbought conditions, MACD and ADX remain neutral, and the price is consolidating within a defined range as intraday buyers encounter resistance, with downside risk favored for the coming week.


-
 Afghanistan
-
 Albania
-
 Algeria
-
 Angola
-
 Argentina
-
 Armenia
-
 Australia
-
 Austria
-
 Azerbaijan
-
 Bahamas
-
 Bahrain
-
 Bangladesh
-
 Belarus
-
 Belgium
-
 Bolivia
-
 Botswana
-
 Brazil
-
 Brunei
-
 Bulgaria
-
 Cambodia
-
 Cameroon
-
 Canada
-
 Chile
Chile
-
 China
China
-
 Colombia
-
 Congo
Congo
-
 Costa Rica
-
 Cote d'Ivoire
-
 Croatia
-
 Cuba
Cuba
-
 Cyprus
-
 Czechia
-
 DR Congo
-
 Denmark
-
 Dominican Republic
-
 Ecuador
-
 Egypt
Egypt
-
 El Salvador
-
 Estonia
-
 Eswatini
-
 Ethiopia
-
 Finland
-
 France
-
 Georgia
-
 Germany
-
 Ghana
Ghana
-
 Greece
-
 Haiti
Haiti
-
 Hong Kong
-
 Hungary
-
 India
India
-
 Indonesia
-
 Iran, Islamic republic
-
 Iraq
Iraq
-
 Ireland
-
 Israel
-
 Italy
Italy
-
 Jamaica
-
 Japan
Japan
-
 Jordan
-
 Kazakhstan
-
 Kenya
Kenya
-
 Korea
Korea
-
 Kuwait
-
 Kyrgyzstan
-
 Laos
Laos
-
 Latvia
-
 Lebanon
-
 Lesotho
-
 Libya
Libya
-
 Lithuania
-
 Luxembourg
-
 Madagascar
-
 Malaysia
-
 Malta
Malta
-
 Mauritius
-
 Mexico
-
 Moldova
-
 Mongolia
-
 Montenegro
-
 Morocco
-
 Mozambique
-
 Myanmar
-
 Namibia
-
 Nepal
Nepal
-
 Netherlands
-
 New Zealand
-
 Nigeria
-
 North Macedonia
-
 Norway
-
 Oman
Oman
-
 Pakistan
-
 Palestine
-
 Panama
-
 Papua New Guinea
-
 Paraguay
-
 Peru
Peru
-
 Philippines
-
 Poland
-
 Portugal
-
 Puerto Rico
-
 Qatar
Qatar
-
 Reunion
-
 Romania
-
 Rwanda
-
 Saudi Arabia
-
 Serbia
-
 Singapore
-
 Slovakia
-
 Slovenia
-
 Somalia
-
 South Africa
-
 Spain
Spain
-
 Sri Lanka
-
 Sweden
-
 Switzerland
-
 Syria
Syria
-
 Taiwan
-
 Tajikistan
-
 Tanzania
-
 Thailand
-
 Trinidad and Tobago
-
 Tunisia
-
 Turkey
-
 UAE
UAE
-
 Uganda
-
 Ukraine
-
 United Kingdom
-
United States
-
 Uruguay
-
 Uzbekistan
-
 Venezuela
-
 Vietnam
-
 Yemen
Yemen
-
 Zambia
-
 Zimbabwe
- Forex
- Crypto
