
Sundial Growers stock rises 4.55% as intraday buyers dominate despite mixed momentum

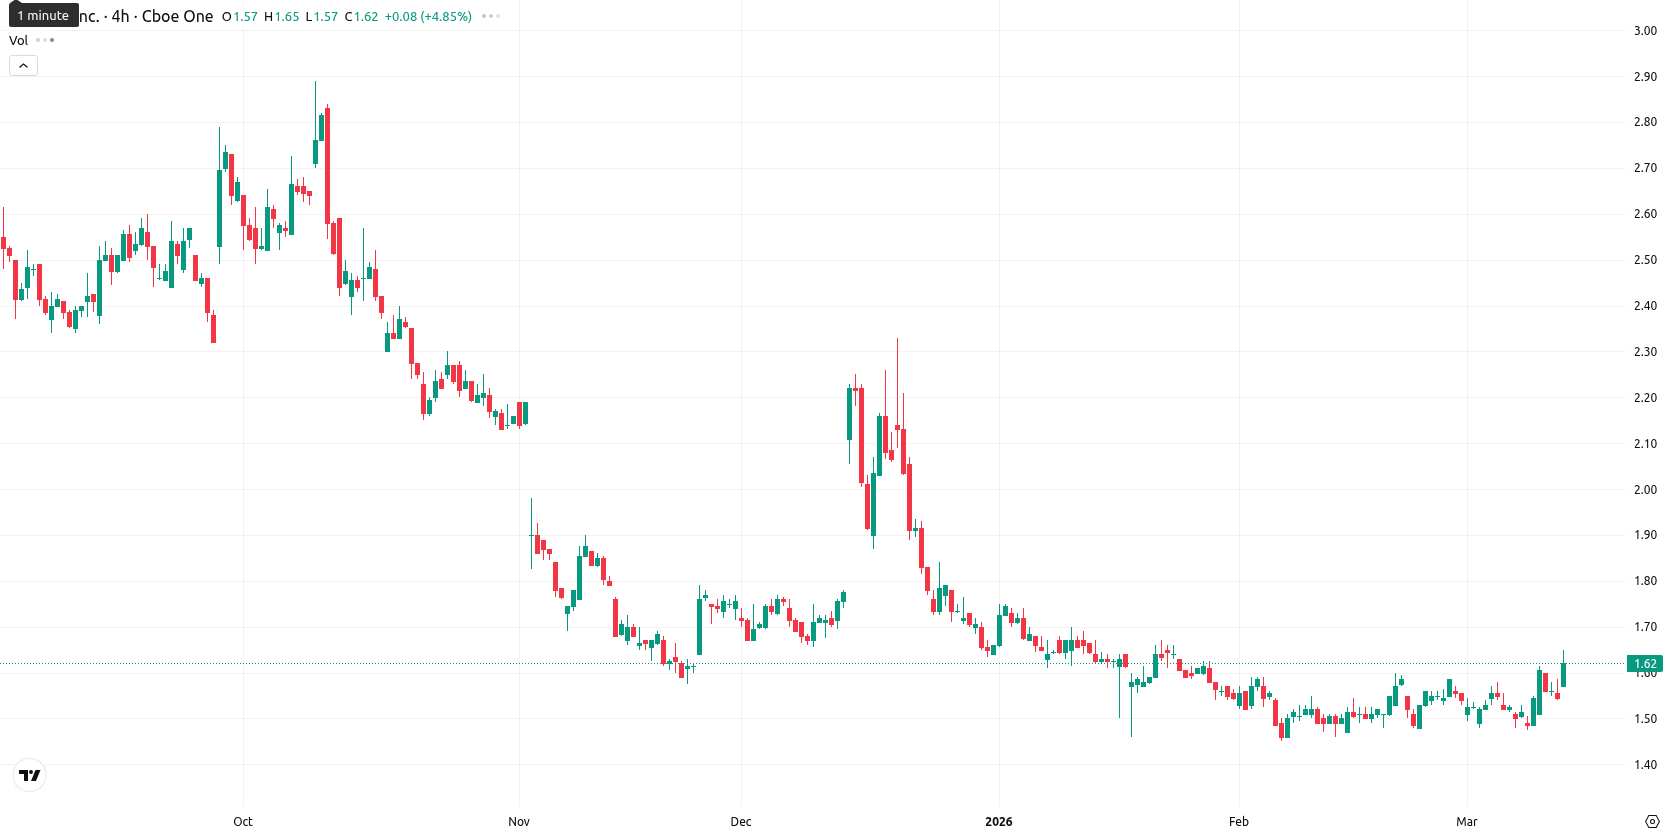
SNDL Inc. (SNDL) is trading at $1.61 after advancing 4.55% today. The price sits above both its MA-20 ($1.53) and MA-50 ($1.58), but remains well below the MA-200 ($1.81), highlighting near-term bullish momentum while long-term seller pressure persists; the Ichimoku Kijun at $1.53 acts as initial support.
Highlights
- SNDL is experiencing short-term bullish momentum as price trades above key short-term moving averages but below longer-term trend levels.
- Technical signals are mixed, with several oscillators reflecting ongoing indecision and recent intraday buyer dominance despite underlying weakness.
- Price is expected to trade between $1.56 and $1.67 this week, with breakout probability low and downside risk prevailing.
Mixed momentum as intraday buyers meet conflicting indicator signals
Momentum signals are mixed; D1 MACD points to strong selling, while ADX reads neutral and D1 RSI sits just below the midpoint at 48.48, indicating indecision. Stoch RSI on D1 signals strong selling, but CCI is in "Buy" territory and BBP reflects buyer dominance for the intraday session. The session opened higher with no gap and is trending near the day's high of $1.65, showing moderate volatility and persistent strength toward session highs.
Consolidation expected as breakout odds remain limited amid weekly weakness
For the week ahead, the typical volatility band is expected between $1.56 and $1.67, with continued sideways movement likely. The upside breakout probability is low (below 20%), so further consolidation between immediate support at $1.53 and recent highs is projected. A sustained push above $1.65 would be required for further bullish continuation, while a break below $1.56 — $1.53 could trigger renewed selling pressure due to residual weekly weakness.
Last time, analysts noted that SNDL is showing short-term bullish momentum as it trades above its 20- and 50-day moving averages but remains under longer-term pressure below the 200-day average. However, despite strong intraday gains and price action near resistance, mixed momentum signals—including a bearish MACD and neutral RSI—indicate the move lacks confirmation across broader timeframes.


-
 Afghanistan
-
 Albania
-
 Algeria
-
 Angola
-
 Argentina
-
 Armenia
-
 Australia
-
 Austria
-
 Azerbaijan
-
 Bahamas
-
 Bahrain
-
 Bangladesh
-
 Belarus
-
 Belgium
-
 Bolivia
-
 Botswana
-
 Brazil
-
 Brunei
-
 Bulgaria
-
 Cambodia
-
 Cameroon
-
 Canada
-
 Chile
Chile
-
 China
China
-
 Colombia
-
 Congo
Congo
-
 Costa Rica
-
 Cote d'Ivoire
-
 Croatia
-
 Cuba
Cuba
-
 Cyprus
-
 Czechia
-
 DR Congo
-
 Denmark
-
 Dominican Republic
-
 Ecuador
-
 Egypt
Egypt
-
 El Salvador
-
 Estonia
-
 Eswatini
-
 Ethiopia
-
 Finland
-
 France
-
 Georgia
-
 Germany
-
 Ghana
Ghana
-
 Greece
-
 Haiti
Haiti
-
 Hong Kong
-
 Hungary
-
 India
India
-
 Indonesia
-
 Iran, Islamic republic
-
 Iraq
Iraq
-
 Ireland
-
 Israel
-
 Italy
Italy
-
 Jamaica
-
 Japan
Japan
-
 Jordan
-
 Kazakhstan
-
 Kenya
Kenya
-
 Korea
Korea
-
 Kuwait
-
 Kyrgyzstan
-
 Laos
Laos
-
 Latvia
-
 Lebanon
-
 Lesotho
-
 Libya
Libya
-
 Lithuania
-
 Luxembourg
-
 Madagascar
-
 Malaysia
-
 Malta
Malta
-
 Mauritius
-
 Mexico
-
 Moldova
-
 Mongolia
-
 Montenegro
-
 Morocco
-
 Mozambique
-
 Myanmar
-
 Namibia
-
 Nepal
Nepal
-
 Netherlands
-
 New Zealand
-
 Nigeria
-
 North Macedonia
-
 Norway
-
 Oman
Oman
-
 Pakistan
-
 Palestine
-
 Panama
-
 Papua New Guinea
-
 Paraguay
-
 Peru
Peru
-
 Philippines
-
 Poland
-
 Portugal
-
 Puerto Rico
-
 Qatar
Qatar
-
 Reunion
-
 Romania
-
 Rwanda
-
 Saudi Arabia
-
 Serbia
-
 Singapore
-
 Slovakia
-
 Slovenia
-
 Somalia
-
 South Africa
-
 Spain
Spain
-
 Sri Lanka
-
 Sweden
-
 Switzerland
-
 Syria
Syria
-
 Taiwan
-
 Tajikistan
-
 Tanzania
-
 Thailand
-
 Trinidad and Tobago
-
 Tunisia
-
 Turkey
-
 UAE
UAE
-
 Uganda
-
 Ukraine
-
 United Kingdom
-
United States
-
 Uruguay
-
 Uzbekistan
-
 Venezuela
-
 Vietnam
-
 Yemen
Yemen
-
 Zambia
-
 Zimbabwe
- Forex
- Crypto
