
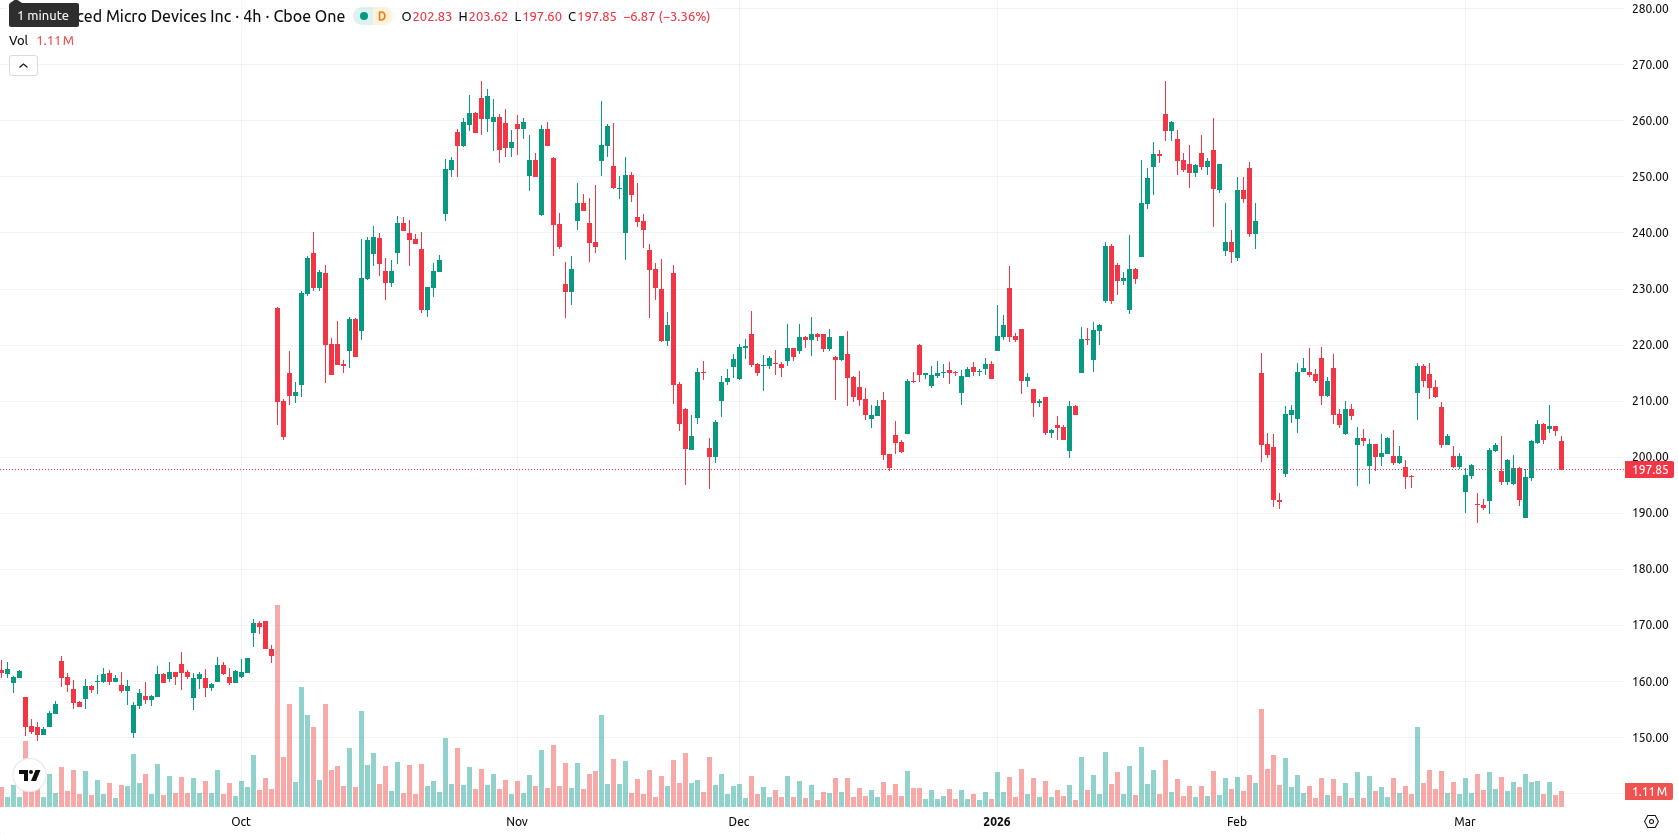
AMD stock price forecast: Near-term support and resistance shape outlook as AMD drops 3.46%

Advanced Micro Devices, Inc. (AMD) is trading at $197.76 after a daily decrease of 3.46%. The asset has moved below both its MA-20 ($202.65) and MA-50 ($216.92), but remains above the MA-200 ($189.98), reflecting short- and medium-term weakness while retaining longer-term support.
Highlights
- AMD is trading under short- and medium-term moving averages, reflecting persistent downside pressure from recent sellers.
- Momentum indicators show mixed signals, with strong selling, weak trend conviction, and overbought conditions suggesting limited near-term upside.
- Expected five-day range is $190–$208, baseline scenario calls for sideways consolidation unless a break of $220.44 or $189.98 occurs.
Mixed momentum as sellers dominate amid fading buyer strength
The technical landscape for AMD shows ongoing downward pressure, with the current price below the MA-20 and MA-50, and just above the MA-200. The Ichimoku Kijun at $220.44 marks immediate resistance. Momentum indicators are mixed: the MACD signals strong selling, the ADX shows weak trend conviction, and the D1 RSI is neutrality leaning bearish. Stoch RSI and BBP indicate overbought conditions, suggesting a decline in recent buyer dominance, while intraday volatility remains elevated with sellers in control near session lows.
Sideways consolidation seen as technical signals balance
Over the next five trading days, AMD is expected to fluctuate within a $190 to $208 volatility band relative to current levels. The probability of price movement is balanced, with roughly equal chances of an increase or decline based on weekly MA-50, MACD, and RSI signals. The most likely scenario is sideways consolidation within this range. A breakout above $220.44 would indicate bullish momentum, while a clear drop below $189.98 signals further weakness.
Previously it was reported that AMD is trading above its short-term SMA-20 and long-term SMA-200, but remains below the medium-term SMA-50, with mixed technical indicators showing mild bullish short-term momentum overshadowed by sustained selling pressure and indecisive intraday signals. Resistance is seen near $220 while downside risks predominate, with volatility expected to keep prices oscillating in the mid-$200s and breakout probability regarded as low.


-
 Afghanistan
-
 Albania
-
 Algeria
-
 Angola
-
 Argentina
-
 Armenia
-
 Australia
-
 Austria
-
 Azerbaijan
-
 Bahamas
-
 Bahrain
-
 Bangladesh
-
 Belarus
-
 Belgium
-
 Bolivia
-
 Botswana
-
 Brazil
-
 Brunei
-
 Bulgaria
-
 Cambodia
-
 Cameroon
-
 Canada
-
 Chile
Chile
-
 China
China
-
 Colombia
-
 Congo
Congo
-
 Costa Rica
-
 Cote d'Ivoire
-
 Croatia
-
 Cuba
Cuba
-
 Cyprus
-
 Czechia
-
 DR Congo
-
 Denmark
-
 Dominican Republic
-
 Ecuador
-
 Egypt
Egypt
-
 El Salvador
-
 Estonia
-
 Eswatini
-
 Ethiopia
-
 Finland
-
 France
-
 Georgia
-
 Germany
-
 Ghana
Ghana
-
 Greece
-
 Haiti
Haiti
-
 Hong Kong
-
 Hungary
-
 India
India
-
 Indonesia
-
 Iran, Islamic republic
-
 Iraq
Iraq
-
 Ireland
-
 Israel
-
 Italy
Italy
-
 Jamaica
-
 Japan
Japan
-
 Jordan
-
 Kazakhstan
-
 Kenya
Kenya
-
 Korea
Korea
-
 Kuwait
-
 Kyrgyzstan
-
 Laos
Laos
-
 Latvia
-
 Lebanon
-
 Lesotho
-
 Libya
Libya
-
 Lithuania
-
 Luxembourg
-
 Madagascar
-
 Malaysia
-
 Malta
Malta
-
 Mauritius
-
 Mexico
-
 Moldova
-
 Mongolia
-
 Montenegro
-
 Morocco
-
 Mozambique
-
 Myanmar
-
 Namibia
-
 Nepal
Nepal
-
 Netherlands
-
 New Zealand
-
 Nigeria
-
 North Macedonia
-
 Norway
-
 Oman
Oman
-
 Pakistan
-
 Palestine
-
 Panama
-
 Papua New Guinea
-
 Paraguay
-
 Peru
Peru
-
 Philippines
-
 Poland
-
 Portugal
-
 Puerto Rico
-
 Qatar
Qatar
-
 Reunion
-
 Romania
-
 Rwanda
-
 Saudi Arabia
-
 Serbia
-
 Singapore
-
 Slovakia
-
 Slovenia
-
 Somalia
-
 South Africa
-
 Spain
Spain
-
 Sri Lanka
-
 Sweden
-
 Switzerland
-
 Syria
Syria
-
 Taiwan
-
 Tajikistan
-
 Tanzania
-
 Thailand
-
 Trinidad and Tobago
-
 Tunisia
-
 Turkey
-
 UAE
UAE
-
 Uganda
-
 Ukraine
-
 United Kingdom
-
United States
-
 Uruguay
-
 Uzbekistan
-
 Venezuela
-
 Vietnam
-
 Yemen
Yemen
-
 Zambia
-
 Zimbabwe
- Forex
- Crypto
