
-0.98% for AMD stock — Downward momentum signals limited recovery prospects

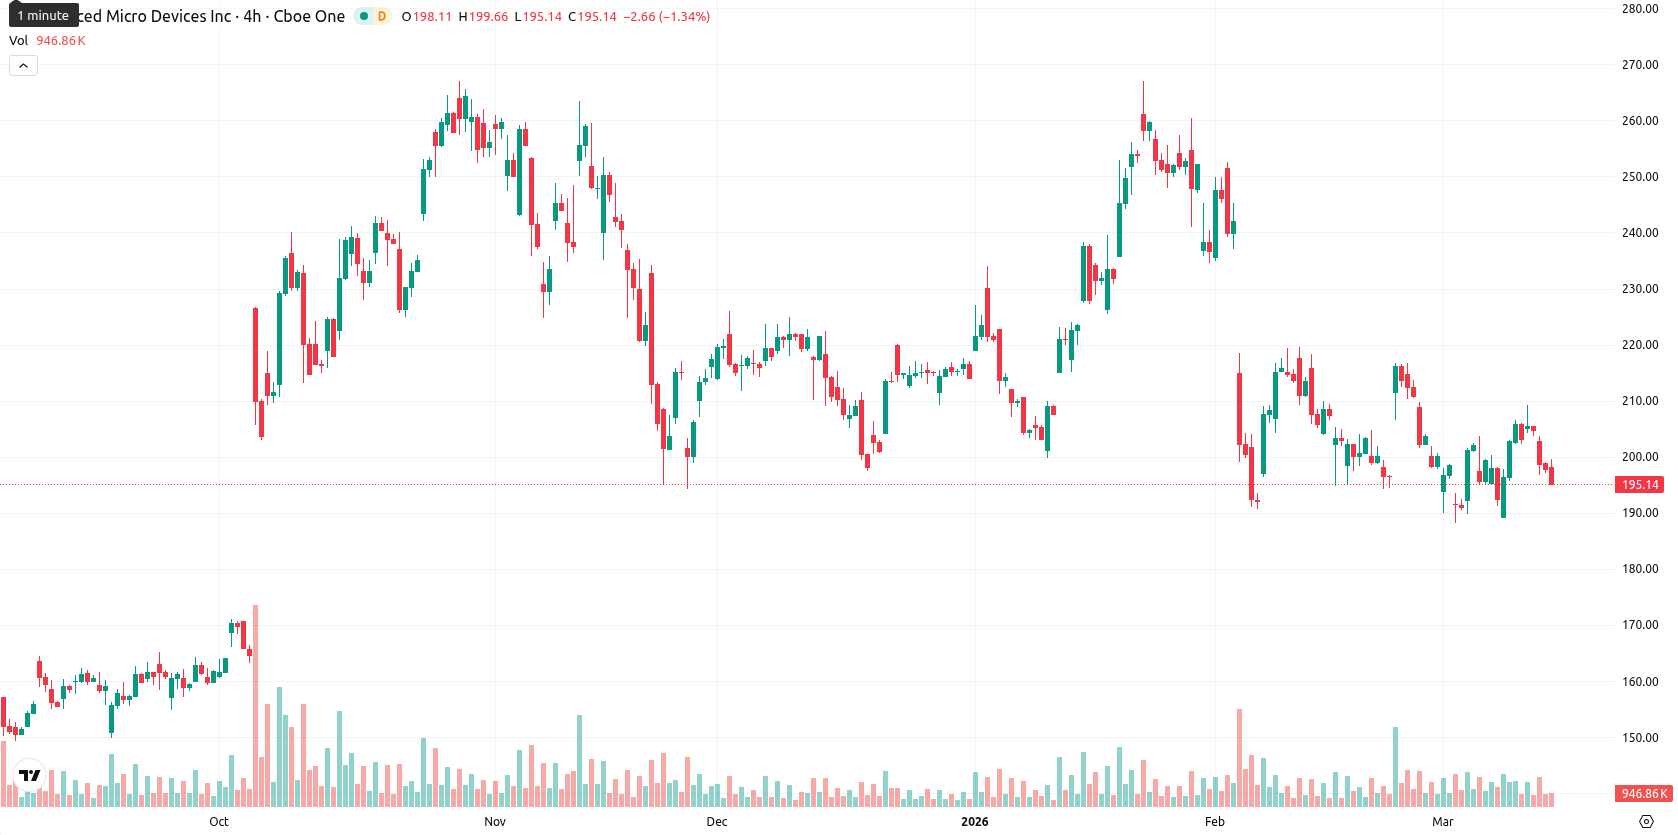
Advanced Micro Devices, Inc. (AMD) is trading at $195.80 after falling 0.98% on the day. The price is below the MA-20 ($201.86) and MA-50 ($216.56), but remains above the MA-200 ($190.42), showing short- and medium-term selling pressure while the long-term trend still holds above key support.
Highlights
- AMD is under sustained seller pressure, trading below key short- and medium-term moving averages but above long-term support.
- Bearish momentum dominates as multiple indicators signal downside risk, with weak directional strength and short-term exhaustion signals emerging.
- Over the next five sessions, AMD is expected to consolidate between $188.00 and $205.00, with a breakout or breakdown likely to set next direction.
Bearish momentum reinforced amid neutral bias in oscillators
The technical outlook stays bearish, with AMD consolidating below the short- and medium-term moving averages, while immediate resistance is marked by the Ichimoku Kijun at $203.94. Momentum indicators reinforce this downward tone: the daily MACD and RSI both reflect prevailing sell pressure, and the ADX at 14.68 signals limited directional strength. The Stoch RSI and CCI are near neutral but lean slightly oversold in shorter timeframes, hinting at some short-term exhaustion of sellers, whereas BBP points to ongoing seller dominance intraday, and the Awesome Oscillator remains neutral regarding the current move. Today’s session opened with a minor gap up before retreating, resulting in a close near the daily lows and moderate intraday volatility.
Further downside likely as upside risk remains limited
Over the next five sessions, AMD is expected to trade between $188.00 and $205.00 under typical volatility conditions. The likelihood of a price increase is low (less than 20%), suggesting further downside is more probable. The base case is for sideways movement just above long-term support, with consolidation between recent lows and the next resistance. A break above $204 could open a test of higher levels, while a move below $190 would expose AMD to further selling toward recent weekly lows.
Previously it was reported that AMD was exhibiting technical weakness in the short and medium term, with longer-term support limiting more significant declines. The persistence of bearish momentum and only mild support exhaustion suggests traders should monitor for a decisive break below $190 as a trigger for renewed downside risk in the coming sessions.


-
 Afghanistan
-
 Albania
-
 Algeria
-
 Angola
-
 Argentina
-
 Armenia
-
 Australia
-
 Austria
-
 Azerbaijan
-
 Bahamas
-
 Bahrain
-
 Bangladesh
-
 Belarus
-
 Belgium
-
 Bolivia
-
 Botswana
-
 Brazil
-
 Brunei
-
 Bulgaria
-
 Cambodia
-
 Cameroon
-
 Canada
-
 Chile
Chile
-
 China
China
-
 Colombia
-
 Congo
Congo
-
 Costa Rica
-
 Cote d'Ivoire
-
 Croatia
-
 Cuba
Cuba
-
 Cyprus
-
 Czechia
-
 DR Congo
-
 Denmark
-
 Dominican Republic
-
 Ecuador
-
 Egypt
Egypt
-
 El Salvador
-
 Estonia
-
 Eswatini
-
 Ethiopia
-
 Finland
-
 France
-
 Georgia
-
 Germany
-
 Ghana
Ghana
-
 Greece
-
 Haiti
Haiti
-
 Hong Kong
-
 Hungary
-
 India
India
-
 Indonesia
-
 Iran, Islamic republic
-
 Iraq
Iraq
-
 Ireland
-
 Israel
-
 Italy
Italy
-
 Jamaica
-
 Japan
Japan
-
 Jordan
-
 Kazakhstan
-
 Kenya
Kenya
-
 Korea
Korea
-
 Kuwait
-
 Kyrgyzstan
-
 Laos
Laos
-
 Latvia
-
 Lebanon
-
 Lesotho
-
 Libya
Libya
-
 Lithuania
-
 Luxembourg
-
 Madagascar
-
 Malaysia
-
 Malta
Malta
-
 Mauritius
-
 Mexico
-
 Moldova
-
 Mongolia
-
 Montenegro
-
 Morocco
-
 Mozambique
-
 Myanmar
-
 Namibia
-
 Nepal
Nepal
-
 Netherlands
-
 New Zealand
-
 Nigeria
-
 North Macedonia
-
 Norway
-
 Oman
Oman
-
 Pakistan
-
 Palestine
-
 Panama
-
 Papua New Guinea
-
 Paraguay
-
 Peru
Peru
-
 Philippines
-
 Poland
-
 Portugal
-
 Puerto Rico
-
 Qatar
Qatar
-
 Reunion
-
 Romania
-
 Rwanda
-
 Saudi Arabia
-
 Serbia
-
 Singapore
-
 Slovakia
-
 Slovenia
-
 Somalia
-
 South Africa
-
 Spain
Spain
-
 Sri Lanka
-
 Sweden
-
 Switzerland
-
 Syria
Syria
-
 Taiwan
-
 Tajikistan
-
 Tanzania
-
 Thailand
-
 Trinidad and Tobago
-
 Tunisia
-
 Turkey
-
 UAE
UAE
-
 Uganda
-
 Ukraine
-
 United Kingdom
-
United States
-
 Uruguay
-
 Uzbekistan
-
 Venezuela
-
 Vietnam
-
 Yemen
Yemen
-
 Zambia
-
 Zimbabwe
- Forex
- Crypto
