
AMD stock price forecast: Sideways action likely as AMD faces both support and resistance

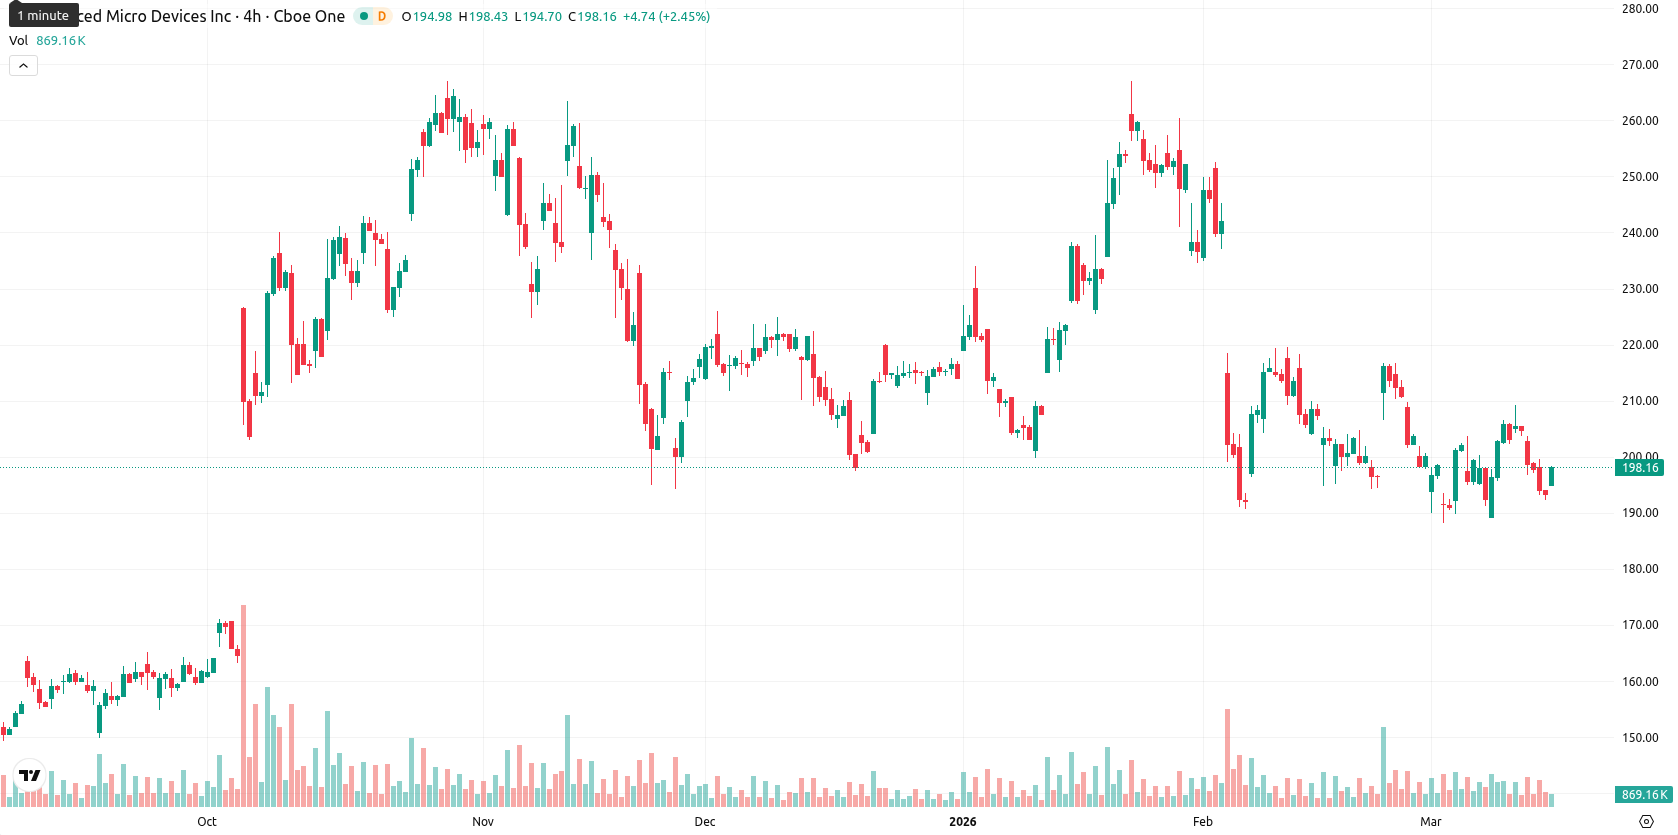
Advanced Micro Devices, Inc. (AMD) is trading at $198.14 after climbing 2.45% today. The stock sits below its SMA-20 ($201.22) and SMA-50 ($216.12), but remains above the SMA-200 ($190.81), highlighting short- to medium-term bearish pressure while longer-term trends are still supported. The Ichimoku Kijun resistance is at $203.94.
Highlights
- AMD trades below its short- and medium-term moving averages, facing bearish momentum despite longer-term support remaining intact.
- Momentum indicators are mixed, with consistent selling pressure and several metrics signaling oversold conditions, suggesting possible short-term stabilization.
- Price is likely to remain rangebound between $190 and $208 next week, with downside risk dominating unless a sustained breakout above $204 occurs.
Bearish momentum divergence as daily and intraday signals clash
Momentum signals for AMD are mixed: the MACD on the daily chart shows strong selling, while the ADX trend strength is weak and neutral. RSI and CCI both remain in sell territory, with Stoch RSI and Bull/Bear Power pointing to oversold conditions and dominant seller pressure intraday. After a modest gap up from yesterday’s close ($193.39) to today’s open ($194.90), price action is near the top of the session range ($194.82 – $198.40) amid moderate volatility. However, conflict between bearish daily signals and short-term intraday strength indicates divergence.
Downside risk favored as upside probability remains limited
Over the next week, AMD is expected to trade between $190.00 and $208.00, a typical volatility band relative to current levels. With less than a 20% probability for further upside, the downside scenario is favored according to most weekly technical indicators. The base case is for AMD to hold within a sideways band between $190 and $208. A bullish breakout above $204 would open room to the upper range, while a fall below $190 could expose further downside toward previous support.
Previously it was reported that AMD was facing persistent short- and medium-term bearish momentum, with longer-term technical support providing a moderating influence. The current analysis underscores this cautious outlook but highlights growing divergence between daily bearish pressure and short-term intraday strength, positioning $204 as a critical breakout level that could redefine the near-term trend.


-
 Afghanistan
-
 Albania
-
 Algeria
-
 Angola
-
 Argentina
-
 Armenia
-
 Australia
-
 Austria
-
 Azerbaijan
-
 Bahamas
-
 Bahrain
-
 Bangladesh
-
 Belarus
-
 Belgium
-
 Bolivia
-
 Botswana
-
 Brazil
-
 Brunei
-
 Bulgaria
-
 Cambodia
-
 Cameroon
-
 Canada
-
 Chile
Chile
-
 China
China
-
 Colombia
-
 Congo
Congo
-
 Costa Rica
-
 Cote d'Ivoire
-
 Croatia
-
 Cuba
Cuba
-
 Cyprus
-
 Czechia
-
 DR Congo
-
 Denmark
-
 Dominican Republic
-
 Ecuador
-
 Egypt
Egypt
-
 El Salvador
-
 Estonia
-
 Eswatini
-
 Ethiopia
-
 Finland
-
 France
-
 Georgia
-
 Germany
-
 Ghana
Ghana
-
 Greece
-
 Haiti
Haiti
-
 Hong Kong
-
 Hungary
-
 India
India
-
 Indonesia
-
 Iran, Islamic republic
-
 Iraq
Iraq
-
 Ireland
-
 Israel
-
 Italy
Italy
-
 Jamaica
-
 Japan
Japan
-
 Jordan
-
 Kazakhstan
-
 Kenya
Kenya
-
 Korea
Korea
-
 Kuwait
-
 Kyrgyzstan
-
 Laos
Laos
-
 Latvia
-
 Lebanon
-
 Lesotho
-
 Libya
Libya
-
 Lithuania
-
 Luxembourg
-
 Madagascar
-
 Malaysia
-
 Malta
Malta
-
 Mauritius
-
 Mexico
-
 Moldova
-
 Mongolia
-
 Montenegro
-
 Morocco
-
 Mozambique
-
 Myanmar
-
 Namibia
-
 Nepal
Nepal
-
 Netherlands
-
 New Zealand
-
 Nigeria
-
 North Macedonia
-
 Norway
-
 Oman
Oman
-
 Pakistan
-
 Palestine
-
 Panama
-
 Papua New Guinea
-
 Paraguay
-
 Peru
Peru
-
 Philippines
-
 Poland
-
 Portugal
-
 Puerto Rico
-
 Qatar
Qatar
-
 Reunion
-
 Romania
-
 Rwanda
-
 Saudi Arabia
-
 Serbia
-
 Singapore
-
 Slovakia
-
 Slovenia
-
 Somalia
-
 South Africa
-
 Spain
Spain
-
 Sri Lanka
-
 Sweden
-
 Switzerland
-
 Syria
Syria
-
 Taiwan
-
 Tajikistan
-
 Tanzania
-
 Thailand
-
 Trinidad and Tobago
-
 Tunisia
-
 Turkey
-
 UAE
UAE
-
 Uganda
-
 Ukraine
-
 United Kingdom
-
United States
-
 Uruguay
-
 Uzbekistan
-
 Venezuela
-
 Vietnam
-
 Yemen
Yemen
-
 Zambia
-
 Zimbabwe
- Forex
- Crypto
