
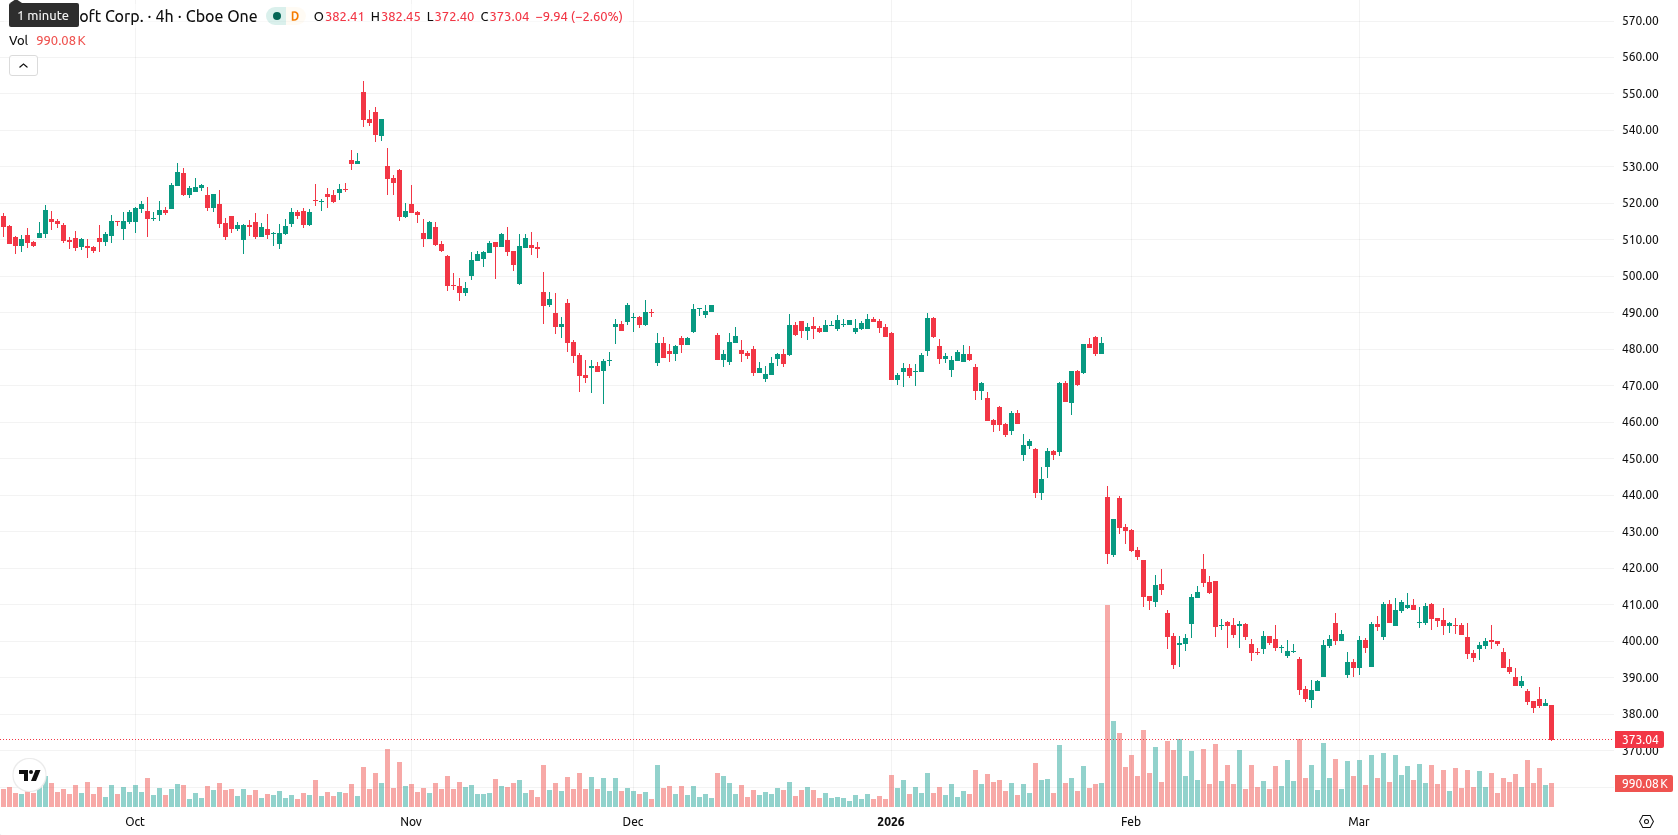
Microsoft stock price forecast: Downside risk persists as MSFT closes below $373

Microsoft Corporation (MSFT) is trading at $372.90 after a 2.63% drop for the day, which places it well below key moving averages including the SMA-20 ($398.66), SMA-50 ($418.86), and SMA-200 ($481.14). The price remains under pressure, with the Ichimoku Kijun level at $396.59 acting as immediate resistance.
Highlights
- Microsoft’s quarterly earnings and revenue both exceeded analyst estimates, with revenue rising 16.7% year-over-year to $81.27 billion.
- OpenAI remains dependent on Microsoft, which holds a 27% diluted stake and backs a reported $625 billion artificial intelligence backlog.
- MSFT trades below major moving averages with persistent downside momentum; expected to move sideways between $370 and $386, with a high risk of further declines.
Earnings beat and AI exposure as broader selling persists
Microsoft reported quarterly earnings per share of $4.14 and revenue of $81.27 billion, both above analyst expectations and reflecting a 16.7% year-over-year increase. The company declared a quarterly dividend of $0.91 per share, payable on June 11, 2026, to shareholders of record as of May 21, 2026. OpenAI's investor disclosures indicated significant reliance on Microsoft for funding and compute resources due to its 27% diluted stake, while Microsoft’s artificial intelligence backlog was reported at approximately $625 billion, though price action has remained under broader selling pressure.
Entrenched seller control amid oversold and bearish indicators
Technical signals for MSFT confirm ongoing seller dominance: the price remains well below short-, medium-, and long-term moving averages (SMA-20, SMA-50, SMA-200), and the Ichimoku Kijun at $396.59 marks immediate overhead resistance. MACD and ADX on both daily and weekly timeframes signal a persistent sell bias, while RSI, CCI, and Stoch RSI point to oversold conditions. BBP highlights intraday seller control, and the Awesome Oscillator is aligned with the prevailing bearish trend, reinforcing downside momentum. Trading near the daily low with no bullish divergence observed reflects high volatility and sustained intraday pressure.
Lower probability of rebound as negative momentum limits upside
Over the next five trading days, MSFT is expected to oscillate within a typical volatility band between $370 and $386. The probability of near-term price gains is low (less than 20%), and further declines are the more likely scenario. The base case is sideways stabilization in the defined range, with a potential upward reversal requiring a break above $396.59, opening the path toward $386.13. A decisive bearish move below $370 could trigger a slide toward new local lows as oversold signals and momentum remain negative.
Earlier, analysts noted that Microsoft shares were under persistent selling pressure and facing heightened regulatory risks, with a cautious outlook prevailing. The latest earnings beat and robust AI growth metrics in the current article underscore that, despite improving fundamentals, the technical environment remains bearish—making a break above $396.59 the critical signal for any potential upside reversal.


Latest Microsoft News


-
 Afghanistan
-
 Albania
-
 Algeria
-
 Angola
-
 Argentina
-
 Armenia
-
 Australia
-
 Austria
-
 Azerbaijan
-
 Bahamas
-
 Bahrain
-
 Bangladesh
-
 Belarus
-
 Belgium
-
 Bolivia
-
 Botswana
-
 Brazil
-
 Brunei
-
 Bulgaria
-
 Cambodia
-
 Cameroon
-
 Canada
-
 Chile
Chile
-
 China
China
-
 Colombia
-
 Congo
Congo
-
 Costa Rica
-
 Cote d'Ivoire
-
 Croatia
-
 Cuba
Cuba
-
 Cyprus
-
 Czechia
-
 DR Congo
-
 Denmark
-
 Dominican Republic
-
 Ecuador
-
 Egypt
Egypt
-
 El Salvador
-
 Estonia
-
 Eswatini
-
 Ethiopia
-
 Finland
-
 France
-
 Georgia
-
 Germany
-
 Ghana
Ghana
-
 Greece
-
 Haiti
Haiti
-
 Hong Kong
-
 Hungary
-
 India
India
-
 Indonesia
-
 Iran, Islamic republic
-
 Iraq
Iraq
-
 Ireland
-
 Israel
-
 Italy
Italy
-
 Jamaica
-
 Japan
Japan
-
 Jordan
-
 Kazakhstan
-
 Kenya
Kenya
-
 Korea
Korea
-
 Kuwait
-
 Kyrgyzstan
-
 Laos
Laos
-
 Latvia
-
 Lebanon
-
 Lesotho
-
 Libya
Libya
-
 Lithuania
-
 Luxembourg
-
 Madagascar
-
 Malaysia
-
 Malta
Malta
-
 Mauritius
-
 Mexico
-
 Moldova
-
 Mongolia
-
 Montenegro
-
 Morocco
-
 Mozambique
-
 Myanmar
-
 Namibia
-
 Nepal
Nepal
-
 Netherlands
-
 New Zealand
-
 Nigeria
-
 North Macedonia
-
 Norway
-
 Oman
Oman
-
 Pakistan
-
 Palestine
-
 Panama
-
 Papua New Guinea
-
 Paraguay
-
 Peru
Peru
-
 Philippines
-
 Poland
-
 Portugal
-
 Puerto Rico
-
 Qatar
Qatar
-
 Reunion
-
 Romania
-
 Rwanda
-
 Saudi Arabia
-
 Serbia
-
 Singapore
-
 Slovakia
-
 Slovenia
-
 Somalia
-
 South Africa
-
 Spain
Spain
-
 Sri Lanka
-
 Sweden
-
 Switzerland
-
 Syria
Syria
-
 Taiwan
-
 Tajikistan
-
 Tanzania
-
 Thailand
-
 Trinidad and Tobago
-
 Tunisia
-
 Turkey
-
 UAE
UAE
-
 Uganda
-
 Ukraine
-
 United Kingdom
-
United States
-
 Uruguay
-
 Uzbekistan
-
 Venezuela
-
 Vietnam
-
 Yemen
Yemen
-
 Zambia
-
 Zimbabwe
- Forex
- Crypto
