
Microsoft stock holds steady as oversold signals follow robust earnings jump

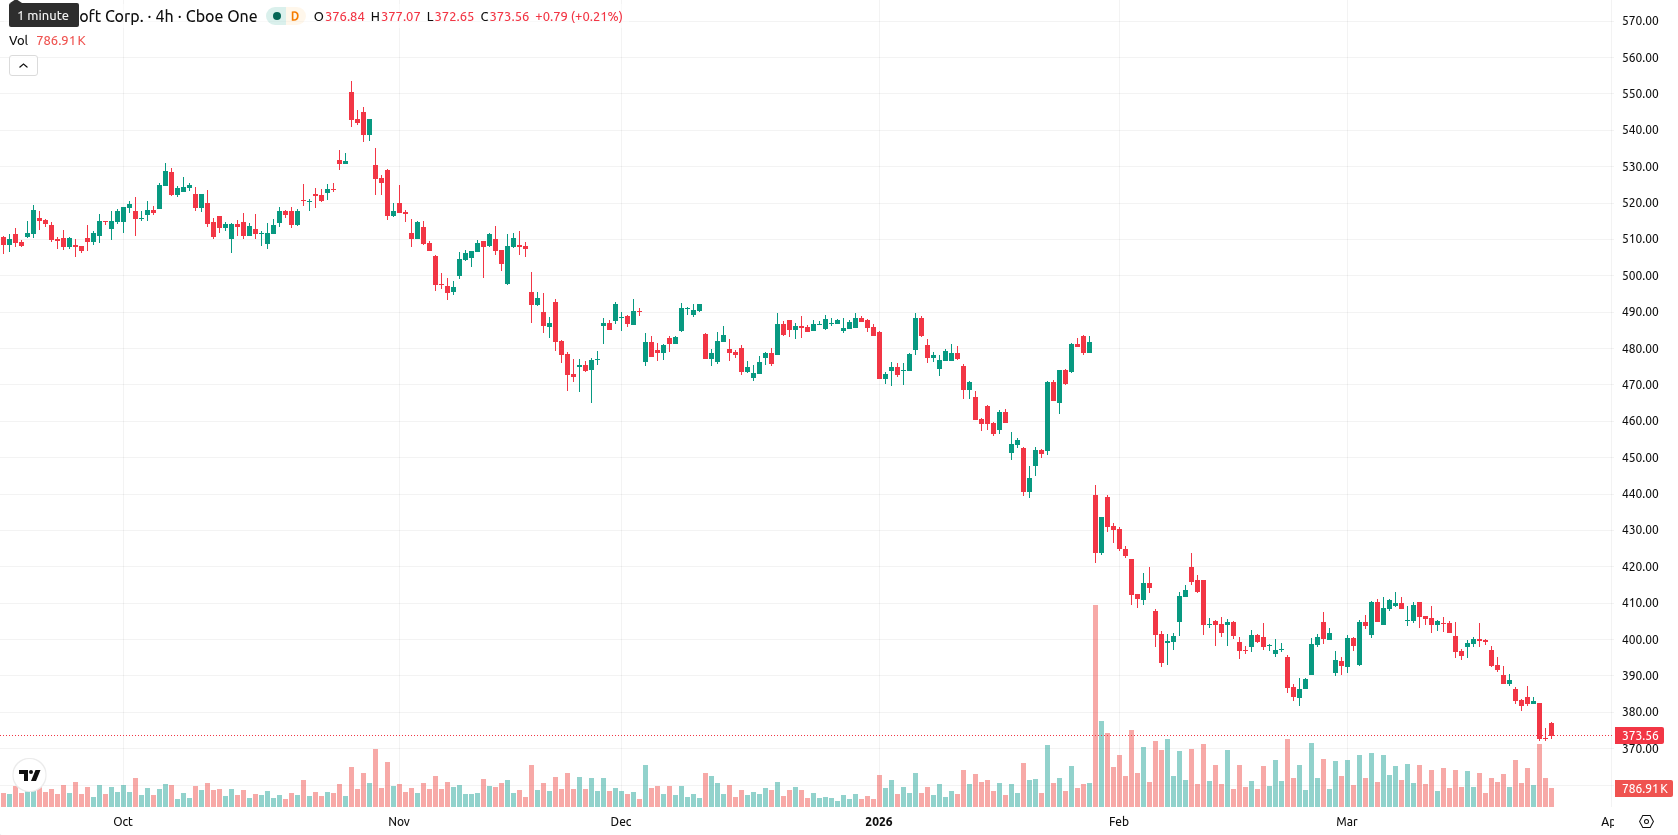
Microsoft Corporation (MSFT) is trading at $373.76, which is below the SMA-20 ($397.83), SMA-50 ($416.72), and SMA-200 ($480.67), indicating that the stock faces persistent seller pressure in the short, medium, and long term. The Ichimoku Kijun level is at $392.43, serving as immediate resistance above the current price.
Highlights
- Microsoft’s quarterly revenue climbed 17% to $81.3 billion, with net income up 60% driven by strong Azure and AI demand.
- Azure posted 39% growth and Microsoft maintains a significant $625 billion AI backlog, underpinned by strategic reliance from OpenAI.
- The stock faces persistent bearish pressure, trading below major averages and is expected to range between $360 and $380 with limited upside.
AI-driven earnings growth intensifies risk as OpenAI dependency rises
Microsoft reported a 17% year-over-year revenue increase to $81.3 billion in its latest quarterly results, with net income rising 60% to $38.5 billion, driven by sustained demand for Azure and a sizable $625 billion AI backlog. Azure's growth was notable, rising 39% in the December quarter as the company continues to emphasize artificial intelligence and cloud expansion. Microsoft also announced a quarterly dividend of $0.91 per share to be paid on June 11, 2026, to shareholders of record as of May 21. OpenAI, a key partner, disclosed in its IPO filings significant reliance on Microsoft for funding and compute power, which presents ongoing business risks.
Bearish momentum dominates as oversold signals persist across indicators
Momentum remains weak, with both MACD and ADX showing ongoing bearish signals. RSI, Stoch RSI, and CCI are all deep in oversold territory, indicating that the stock is technically stretched to the downside. BBP confirms clear seller dominance, and the AO trend also aligns with the prevailing bearish momentum. A small gap up occurred at the open ($375.88 vs. $372.41), but the price remains mid-range within today’s band of $373.11 – $376.71, reflecting low intraday volatility and a sideways tone after the initial open.
Further downside risk as low upside probability defines weekly outlook
For the next week, the expected price range is $360.00 to $380.00, reflecting typical volatility for a blue-chip stock like Microsoft. The probability of a price increase over the coming week is very low (less than 20%), meaning a further decline remains much more likely. Baseline scenario: the price moves sideways between $360.00 and $380.00. Bullish scenario: a break above $380.00 could open the way for a retest of the Ichimoku resistance near $392.43, while a slip below $360.00 would confirm continued weakness and open room for more downside.
Earlier, analysts noted that Microsoft's stock was under sustained bearish pressure amid mounting macroeconomic and geopolitical risks. The latest quarterly results reinforce this cautious stance, with ongoing technical weakness making a break below $360 a key downside risk for investors to monitor in the near term.


Latest Microsoft News


-
 Afghanistan
-
 Albania
-
 Algeria
-
 Angola
-
 Argentina
-
 Armenia
-
 Australia
-
 Austria
-
 Azerbaijan
-
 Bahamas
-
 Bahrain
-
 Bangladesh
-
 Belarus
-
 Belgium
-
 Bolivia
-
 Botswana
-
 Brazil
-
 Brunei
-
 Bulgaria
-
 Cambodia
-
 Cameroon
-
 Canada
-
 Chile
Chile
-
 China
China
-
 Colombia
-
 Congo
Congo
-
 Costa Rica
-
 Cote d'Ivoire
-
 Croatia
-
 Cuba
Cuba
-
 Cyprus
-
 Czechia
-
 DR Congo
-
 Denmark
-
 Dominican Republic
-
 Ecuador
-
 Egypt
Egypt
-
 El Salvador
-
 Estonia
-
 Eswatini
-
 Ethiopia
-
 Finland
-
 France
-
 Georgia
-
 Germany
-
 Ghana
Ghana
-
 Greece
-
 Haiti
Haiti
-
 Hong Kong
-
 Hungary
-
 India
India
-
 Indonesia
-
 Iran, Islamic republic
-
 Iraq
Iraq
-
 Ireland
-
 Israel
-
 Italy
Italy
-
 Jamaica
-
 Japan
Japan
-
 Jordan
-
 Kazakhstan
-
 Kenya
Kenya
-
 Korea
Korea
-
 Kuwait
-
 Kyrgyzstan
-
 Laos
Laos
-
 Latvia
-
 Lebanon
-
 Lesotho
-
 Libya
Libya
-
 Lithuania
-
 Luxembourg
-
 Madagascar
-
 Malaysia
-
 Malta
Malta
-
 Mauritius
-
 Mexico
-
 Moldova
-
 Mongolia
-
 Montenegro
-
 Morocco
-
 Mozambique
-
 Myanmar
-
 Namibia
-
 Nepal
Nepal
-
 Netherlands
-
 New Zealand
-
 Nigeria
-
 North Macedonia
-
 Norway
-
 Oman
Oman
-
 Pakistan
-
 Palestine
-
 Panama
-
 Papua New Guinea
-
 Paraguay
-
 Peru
Peru
-
 Philippines
-
 Poland
-
 Portugal
-
 Puerto Rico
-
 Qatar
Qatar
-
 Reunion
-
 Romania
-
 Rwanda
-
 Saudi Arabia
-
 Serbia
-
 Singapore
-
 Slovakia
-
 Slovenia
-
 Somalia
-
 South Africa
-
 Spain
Spain
-
 Sri Lanka
-
 Sweden
-
 Switzerland
-
 Syria
Syria
-
 Taiwan
-
 Tajikistan
-
 Tanzania
-
 Thailand
-
 Trinidad and Tobago
-
 Tunisia
-
 Turkey
-
 UAE
UAE
-
 Uganda
-
 Ukraine
-
 United Kingdom
-
United States
-
 Uruguay
-
 Uzbekistan
-
 Venezuela
-
 Vietnam
-
 Yemen
Yemen
-
 Zambia
-
 Zimbabwe
- Forex
- Crypto
