
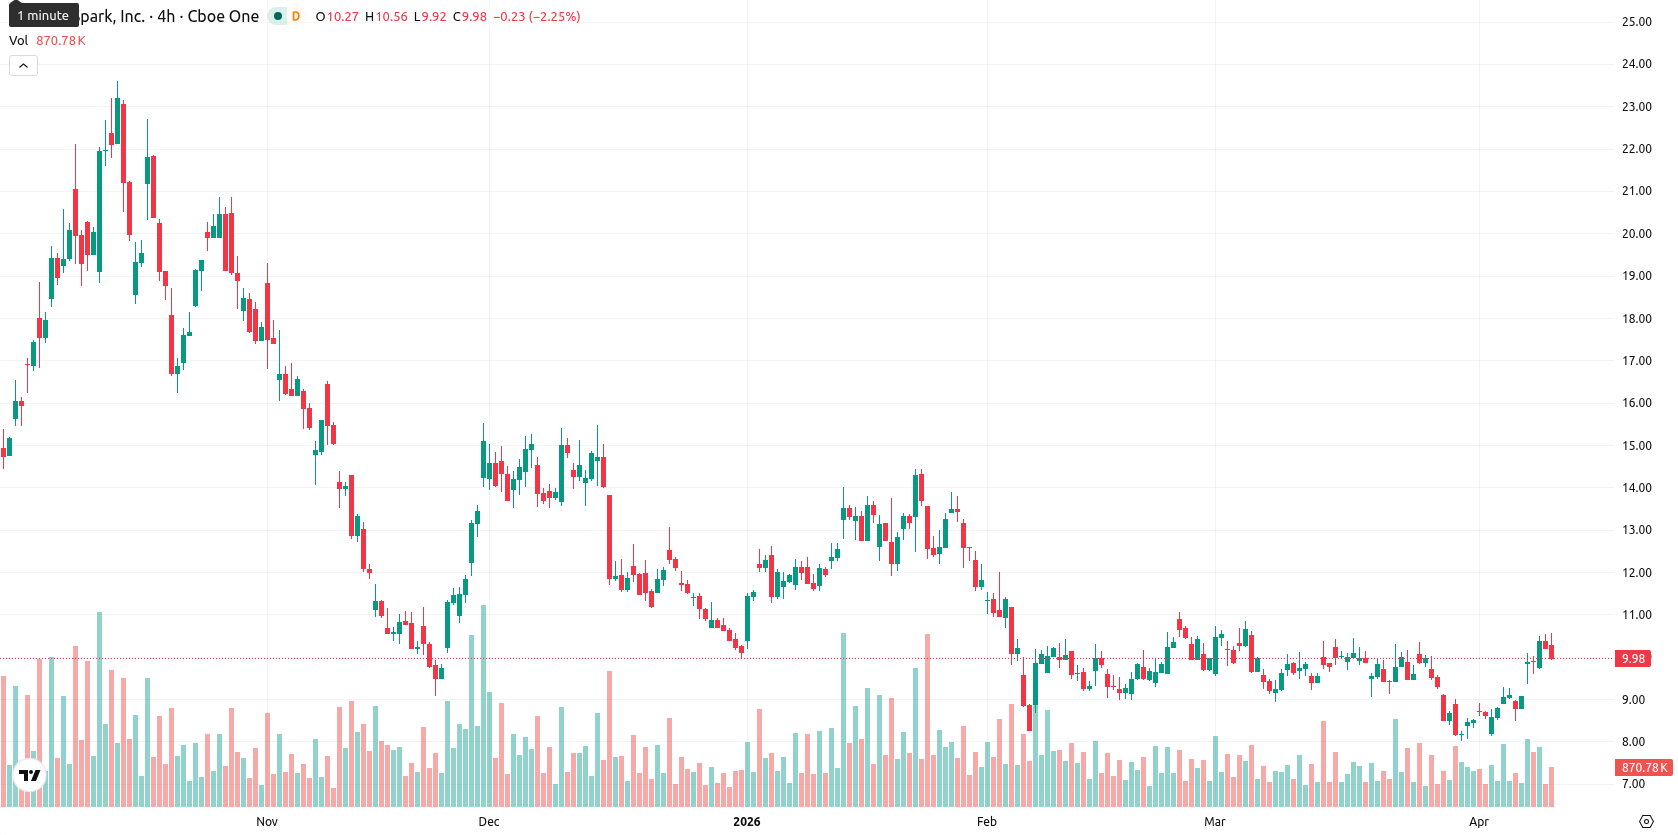
CleanSpark stock slips as upside momentum fades after a test of the $10.10 ceiling

CleanSpark Inc. (CLSK) is trading at $9.87, down 3.23% on the day. The price is slightly below the MA-50 ($9.89) but above the MA-20 ($9.42), indicating continued short-term upward momentum but some hesitation in the medium term.
Highlights
- CleanSpark produced 658 Bitcoin in March 2026, operating at a 50.0 EH/s hashrate and holding 13,561 BTC reserves.
- The company secured up to 447 acres in Brazoria County, Texas, supporting a 300 MW power expansion for AI and HPC developments.
- CLSK trades in a narrow $9.80–$10.10 range amid weakening momentum and overbought signals, with downside risk prevailing.
Bitcoin expansion and Texas infrastructure outpaced by broader selloff
CleanSpark reported the production of 658 Bitcoin in March 2026 with an operational hashrate of 50.0 EH/s and fleet efficiency of 16.07 J/Th, while holding 13,561 BTC as of March 31. The company also closed a major land and power acquisition in Brazoria County, Texas, securing up to 447 acres for an initial 300 MW demand load with future expansion potential. Additionally, CleanSpark has accelerated the development of artificial intelligence and high-performance computing infrastructure in Texas, though price action has remained under broader selling pressure.
Overbought readings clash with fading momentum amid lingering bearish signals
CLSK remains well below the MA-200 ($12.21), signaling persistent long-term bearish pressure, while the Ichimoku Kijun level at $9.43 is an immediate resistance. Momentum signals are mixed: the MACD on D1 shows a strong sell and ADX is neutral, indicating weak trend strength and a possible loss of upside momentum. RSI at 56.52 and CCI at 93.17 are in buy territory, but Stoch RSI and BBP readings point to overbought conditions, with BBP at 1.17 confirming strong buyer dominance today. Awesome Oscillator is neutral, and the current price is near the session low, reflecting moderate intraday volatility and early session pressure. There is a clear divergence between overbought oscillators and weakening momentum signals, indicating short-term exhaustion risk.
Downside risk elevated as weak momentum narrows trading outlook
For the next five trading days, the expected range is $9.80 to $10.10, representing a typical volatility band relative to current levels. The probability of an upside move is low (less than 20%), while downside risk is greater due to negative MACD, weakening RSI, and MA-50 signals on the weekly chart. Sideways trading within a narrow corridor is the most likely scenario. A bullish reversal would require breaking above resistance at $9.43, while a drop below support near $9.80 would open further downside.
Earlier, analysts noted that CleanSpark was navigating persistent bearish momentum despite ongoing operational expansion. With fresh developments in Texas and a growing divergence between overbought oscillators and weakening trend signals, traders should watch for volatility around the $9.80 support level as a breakdown could amplify near-term downside risk.


Latest CleanSpark News


-
 Afghanistan
-
 Albania
-
 Algeria
-
 Angola
-
 Argentina
-
 Armenia
-
 Australia
-
 Austria
-
 Azerbaijan
-
 Bahamas
-
 Bahrain
-
 Bangladesh
-
 Belarus
-
 Belgium
-
 Bolivia
-
 Botswana
-
 Brazil
-
 Brunei
-
 Bulgaria
-
 Cambodia
-
 Cameroon
-
 Canada
-
 Chile
Chile
-
 China
China
-
 Colombia
-
 Congo
Congo
-
 Costa Rica
-
 Cote d'Ivoire
-
 Croatia
-
 Cuba
Cuba
-
 Cyprus
-
 Czechia
-
 DR Congo
-
 Denmark
-
 Dominican Republic
-
 Ecuador
-
 Egypt
Egypt
-
 El Salvador
-
 Estonia
-
 Eswatini
-
 Ethiopia
-
 Finland
-
 France
-
 Georgia
-
 Germany
-
 Ghana
Ghana
-
 Greece
-
 Haiti
Haiti
-
 Hong Kong
-
 Hungary
-
 India
India
-
 Indonesia
-
 Iran, Islamic republic
-
 Iraq
Iraq
-
 Ireland
-
 Israel
-
 Italy
Italy
-
 Jamaica
-
 Japan
Japan
-
 Jordan
-
 Kazakhstan
-
 Kenya
Kenya
-
 Korea
Korea
-
 Kuwait
-
 Kyrgyzstan
-
 Laos
Laos
-
 Latvia
-
 Lebanon
-
 Lesotho
-
 Libya
Libya
-
 Lithuania
-
 Luxembourg
-
 Madagascar
-
 Malaysia
-
 Malta
Malta
-
 Mauritius
-
 Mexico
-
 Moldova
-
 Mongolia
-
 Montenegro
-
 Morocco
-
 Mozambique
-
 Myanmar
-
 Namibia
-
 Nepal
Nepal
-
 Netherlands
-
 New Zealand
-
 Nigeria
-
 North Macedonia
-
 Norway
-
 Oman
Oman
-
 Pakistan
-
 Palestine
-
 Panama
-
 Papua New Guinea
-
 Paraguay
-
 Peru
Peru
-
 Philippines
-
 Poland
-
 Portugal
-
 Puerto Rico
-
 Qatar
Qatar
-
 Reunion
-
 Romania
-
 Rwanda
-
 Saudi Arabia
-
 Serbia
-
 Singapore
-
 Slovakia
-
 Slovenia
-
 Somalia
-
 South Africa
-
 Spain
Spain
-
 Sri Lanka
-
 Sweden
-
 Switzerland
-
 Syria
Syria
-
 Taiwan
-
 Tajikistan
-
 Tanzania
-
 Thailand
-
 Trinidad and Tobago
-
 Tunisia
-
 Turkey
-
 UAE
UAE
-
 Uganda
-
 Ukraine
-
 United Kingdom
-
United States
-
 Uruguay
-
 Uzbekistan
-
 Venezuela
-
 Vietnam
-
 Yemen
Yemen
-
 Zambia
-
 Zimbabwe
- Forex
- Crypto
