
AMD stock holds steady amid recent rally pushing market into overbought territory

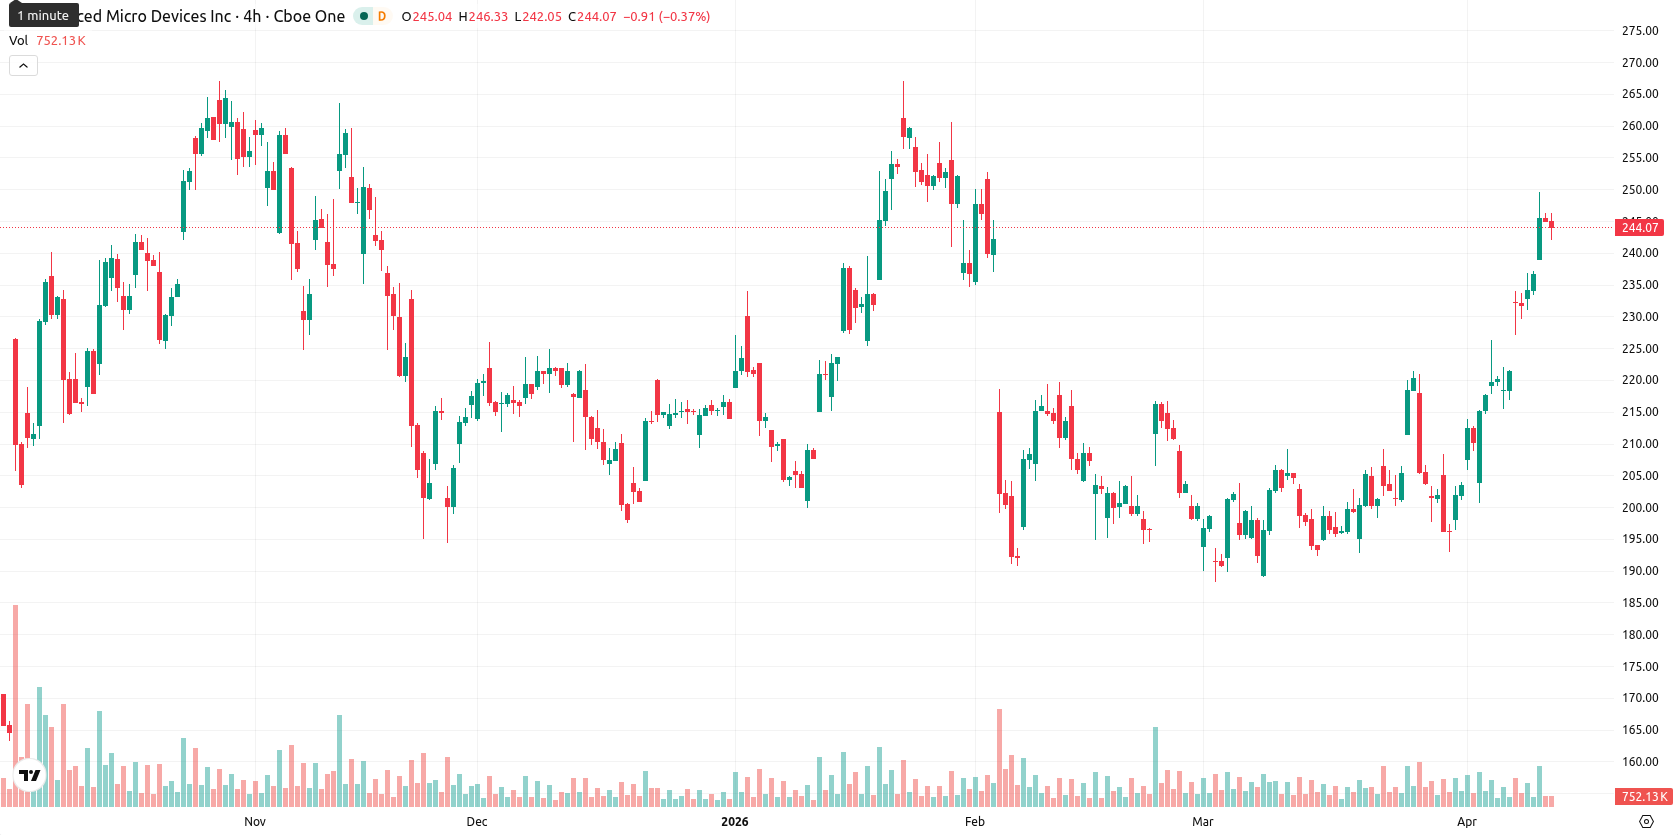
Advanced Micro Devices, Inc. (AMD) is trading at $243.98, down 0.42% for the day. The price remains significantly above the SMA-20 ($210.44), SMA-50 ($209.35), and SMA-200 ($199.41), indicating a sustained bullish structure across all major trends.
Highlights
- AMD maintains a bullish technical structure, with the current price well above key moving average levels across all timeframes.
- Momentum indicators show strong uptrend signals but also flag overbought conditions, suggesting heightened risk of a short-term pause or pullback.
- AMD is expected to consolidate sideways in the $242.00–$249.00 range over the next week, with an 80% probability of upside continuation barring a drop below support.
Uptrend momentum seen as indicators warn of overbought risk
Technical analysis shows AMD sustaining its bullish structure, with the current price well above all key moving averages. The Ichimoku Kijun level at $219.30 acts as immediate support. Momentum indicators are mixed: the MACD signals bullish momentum, but the ADX trend is neutral with low strength. Oscillators are in overbought territory — RSI is at 70.11, Stoch RSI at 100, and CCI also overbought — warning of a possible short-term pullback. BBP indicates intraday buyer dominance but highlights the overbought status, while the Awesome Oscillator also supports the prevailing uptrend. Today’s action shows a modest decline, with AMD trading mid-range in a moderately volatile session, suggesting potential sideways consolidation while underlying momentum stays firm.
Consolidation likely as volatility keeps breakout scenarios in play
In the next five sessions, AMD is expected to move within the $242.00 – $249.00 band, reflecting typical volatility relative to current levels. There is an 80% probability of a price increase, with the baseline scenario calling for sideways movement inside this range. A bullish breakout above $249.00 could signal further upside, while a confirmed drop below $242.00 would open the way for profit-taking or a broader pullback.
Previously it was reported that AMD was exhibiting persistent bullish momentum supported by strong technical signals and elevated demand. The current analysis reinforces this outlook, suggesting that while overbought conditions may create short-term volatility, traders should monitor the $242.00 level for signs of either renewed upside or the onset of a broader pullback.


-
 Afghanistan
-
 Albania
-
 Algeria
-
 Angola
-
 Argentina
-
 Armenia
-
 Australia
-
 Austria
-
 Azerbaijan
-
 Bahamas
-
 Bahrain
-
 Bangladesh
-
 Belarus
-
 Belgium
-
 Bolivia
-
 Botswana
-
 Brazil
-
 Brunei
-
 Bulgaria
-
 Cambodia
-
 Cameroon
-
 Canada
-
 Chile
Chile
-
 China
China
-
 Colombia
-
 Congo
Congo
-
 Costa Rica
-
 Cote d'Ivoire
-
 Croatia
-
 Cuba
Cuba
-
 Cyprus
-
 Czechia
-
 DR Congo
-
 Denmark
-
 Dominican Republic
-
 Ecuador
-
 Egypt
Egypt
-
 El Salvador
-
 Estonia
-
 Eswatini
-
 Ethiopia
-
 Finland
-
 France
-
 Georgia
-
 Germany
-
 Ghana
Ghana
-
 Greece
-
 Haiti
Haiti
-
 Hong Kong
-
 Hungary
-
 India
India
-
 Indonesia
-
 Iran, Islamic republic
-
 Iraq
Iraq
-
 Ireland
-
 Israel
-
 Italy
Italy
-
 Jamaica
-
 Japan
Japan
-
 Jordan
-
 Kazakhstan
-
 Kenya
Kenya
-
 Korea
Korea
-
 Kuwait
-
 Kyrgyzstan
-
 Laos
Laos
-
 Latvia
-
 Lebanon
-
 Lesotho
-
 Libya
Libya
-
 Lithuania
-
 Luxembourg
-
 Madagascar
-
 Malaysia
-
 Malta
Malta
-
 Mauritius
-
 Mexico
-
 Moldova
-
 Mongolia
-
 Montenegro
-
 Morocco
-
 Mozambique
-
 Myanmar
-
 Namibia
-
 Nepal
Nepal
-
 Netherlands
-
 New Zealand
-
 Nigeria
-
 North Macedonia
-
 Norway
-
 Oman
Oman
-
 Pakistan
-
 Palestine
-
 Panama
-
 Papua New Guinea
-
 Paraguay
-
 Peru
Peru
-
 Philippines
-
 Poland
-
 Portugal
-
 Puerto Rico
-
 Qatar
Qatar
-
 Reunion
-
 Romania
-
 Rwanda
-
 Saudi Arabia
-
 Serbia
-
 Singapore
-
 Slovakia
-
 Slovenia
-
 Somalia
-
 South Africa
-
 Spain
Spain
-
 Sri Lanka
-
 Sweden
-
 Switzerland
-
 Syria
Syria
-
 Taiwan
-
 Tajikistan
-
 Tanzania
-
 Thailand
-
 Trinidad and Tobago
-
 Tunisia
-
 Turkey
-
 UAE
UAE
-
 Uganda
-
 Ukraine
-
 United Kingdom
-
United States
-
 Uruguay
-
 Uzbekistan
-
 Venezuela
-
 Vietnam
-
 Yemen
Yemen
-
 Zambia
-
 Zimbabwe
- Forex
- Crypto
