
+1.71% for Arm stock as 2026–2027 earnings expectations increase

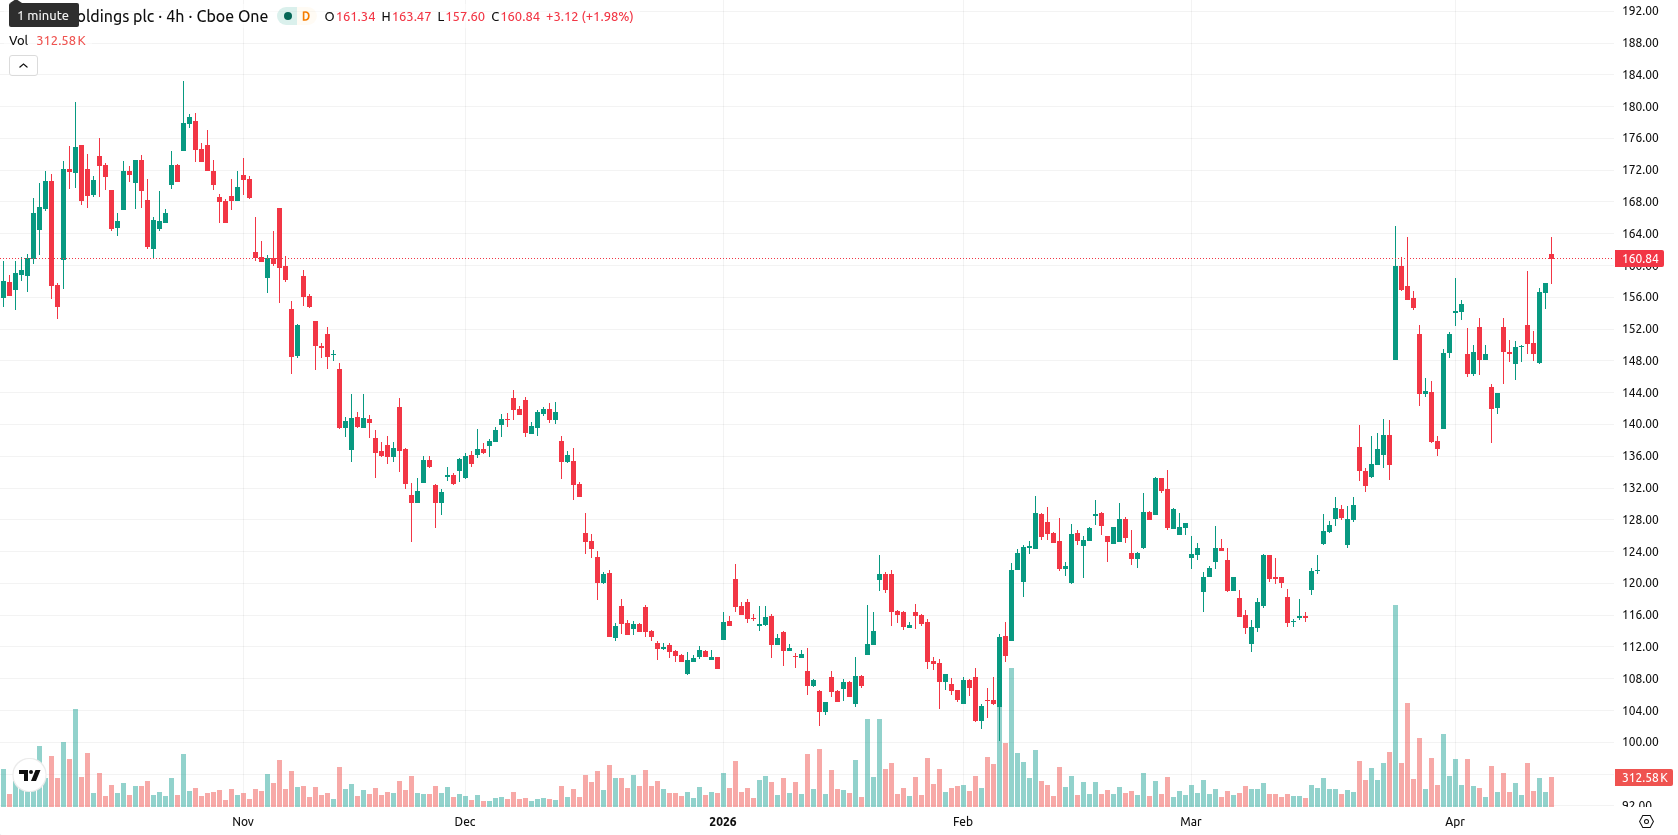
Arm Holdings (ARM) is trading at $160.28, up 1.71% for the day. The asset remains well above its SMA-20 ($142.88), SMA-50 ($129.57), and SMA-200 ($138.58), underscoring bullish momentum across all key timeframes.
Highlights
- Arm's expanded partnerships and new chip launch reinforce its role as a core technology provider in semiconductors.
- Earnings expectations for Arm in 2026 and 2027 have seen modest upward revisions over the past month.
- Arm displays sustained bullish technical momentum, with high probability of gains and expected trading range between $152.00 and $168.00 in the coming week.
Product launches and raised forecasts boost industry positioning
Arm has broadened its presence in the electronics and semiconductor industries through recent partner-launched products, supporting its role as a core technology developer. The company has introduced a new chip expected to contribute substantial revenue over the coming years. Additionally, market expectations for Arm’s earnings in 2026 and 2027 have modestly increased over the past month.
Strong bullish trend as key support holds and momentum persists
Technically, ARM continues to show strong bullish momentum across short-, medium-, and long-term trends. It trades well above the SMA-20 ($142.88), SMA-50 ($129.57), and SMA-200 ($138.58) levels, with the Ichimoku Kijun at $138.98 below current price acting as immediate support. Momentum indicators remain positive: D1 MACD signals “Buy”, ADX is at 16.75, and oscillators show mild overbought readings as RSI stands at 64.06, Stoch RSI shows a “Strong Buy” but is near overbought levels on lower timeframes, and CCI is positive yet close to overbought. BBP reflects strong intraday buying, while the Awesome Oscillator is neutral and does not contradict the uptrend. ARM opened with a notable gap up and currently trades mid-session within a $157.71 – $163.04 range, highlighting moderate volatility and some consolidation following early strength.
Sideways bias as further gains likely on strong momentum alignment
Over the next week, ARM is expected to fluctuate in a typical volatility band between $152.00 and $168.00 relative to current levels. The likelihood of further gains is high (over 80%), supported by aligned weekly and daily momentum as well as moving average signals, while the probability of significant downside is comparatively lower. Baseline expectations are for sideways movement within this range, with a breakout above $168.00 possible if strong momentum and buying persist. A bearish scenario would materialize only if price fell below support at $152.00, likely in response to a clear reversal in momentum or broad market weakness.
Earlier, analysts noted that Arm Holdings displayed broad bullish momentum across multiple timeframes, with technical and price action signals indicating continued strength. The current analysis not only confirms sustained bullish momentum but also highlights increasing earnings expectations and sector expansion, making a breakout above $168 the key level for traders to monitor in the days ahead.


-
 Afghanistan
-
 Albania
-
 Algeria
-
 Angola
-
 Argentina
-
 Armenia
-
 Australia
-
 Austria
-
 Azerbaijan
-
 Bahamas
-
 Bahrain
-
 Bangladesh
-
 Belarus
-
 Belgium
-
 Bolivia
-
 Botswana
-
 Brazil
-
 Brunei
-
 Bulgaria
-
 Cambodia
-
 Cameroon
-
 Canada
-
 Chile
Chile
-
 China
China
-
 Colombia
-
 Congo
Congo
-
 Costa Rica
-
 Cote d'Ivoire
-
 Croatia
-
 Cuba
Cuba
-
 Cyprus
-
 Czechia
-
 DR Congo
-
 Denmark
-
 Dominican Republic
-
 Ecuador
-
 Egypt
Egypt
-
 El Salvador
-
 Estonia
-
 Eswatini
-
 Ethiopia
-
 Finland
-
 France
-
 Georgia
-
 Germany
-
 Ghana
Ghana
-
 Greece
-
 Haiti
Haiti
-
 Hong Kong
-
 Hungary
-
 India
India
-
 Indonesia
-
 Iran, Islamic republic
-
 Iraq
Iraq
-
 Ireland
-
 Israel
-
 Italy
Italy
-
 Jamaica
-
 Japan
Japan
-
 Jordan
-
 Kazakhstan
-
 Kenya
Kenya
-
 Korea
Korea
-
 Kuwait
-
 Kyrgyzstan
-
 Laos
Laos
-
 Latvia
-
 Lebanon
-
 Lesotho
-
 Libya
Libya
-
 Lithuania
-
 Luxembourg
-
 Madagascar
-
 Malaysia
-
 Malta
Malta
-
 Mauritius
-
 Mexico
-
 Moldova
-
 Mongolia
-
 Montenegro
-
 Morocco
-
 Mozambique
-
 Myanmar
-
 Namibia
-
 Nepal
Nepal
-
 Netherlands
-
 New Zealand
-
 Nigeria
-
 North Macedonia
-
 Norway
-
 Oman
Oman
-
 Pakistan
-
 Palestine
-
 Panama
-
 Papua New Guinea
-
 Paraguay
-
 Peru
Peru
-
 Philippines
-
 Poland
-
 Portugal
-
 Puerto Rico
-
 Qatar
Qatar
-
 Reunion
-
 Romania
-
 Rwanda
-
 Saudi Arabia
-
 Serbia
-
 Singapore
-
 Slovakia
-
 Slovenia
-
 Somalia
-
 South Africa
-
 Spain
Spain
-
 Sri Lanka
-
 Sweden
-
 Switzerland
-
 Syria
Syria
-
 Taiwan
-
 Tajikistan
-
 Tanzania
-
 Thailand
-
 Trinidad and Tobago
-
 Tunisia
-
 Turkey
-
 UAE
UAE
-
 Uganda
-
 Ukraine
-
 United Kingdom
-
United States
-
 Uruguay
-
 Uzbekistan
-
 Venezuela
-
 Vietnam
-
 Yemen
Yemen
-
 Zambia
-
 Zimbabwe
- Forex
- Crypto
