
+9.44% for Robinhood stock as US Treasury Trump Accounts initiative spurs interest

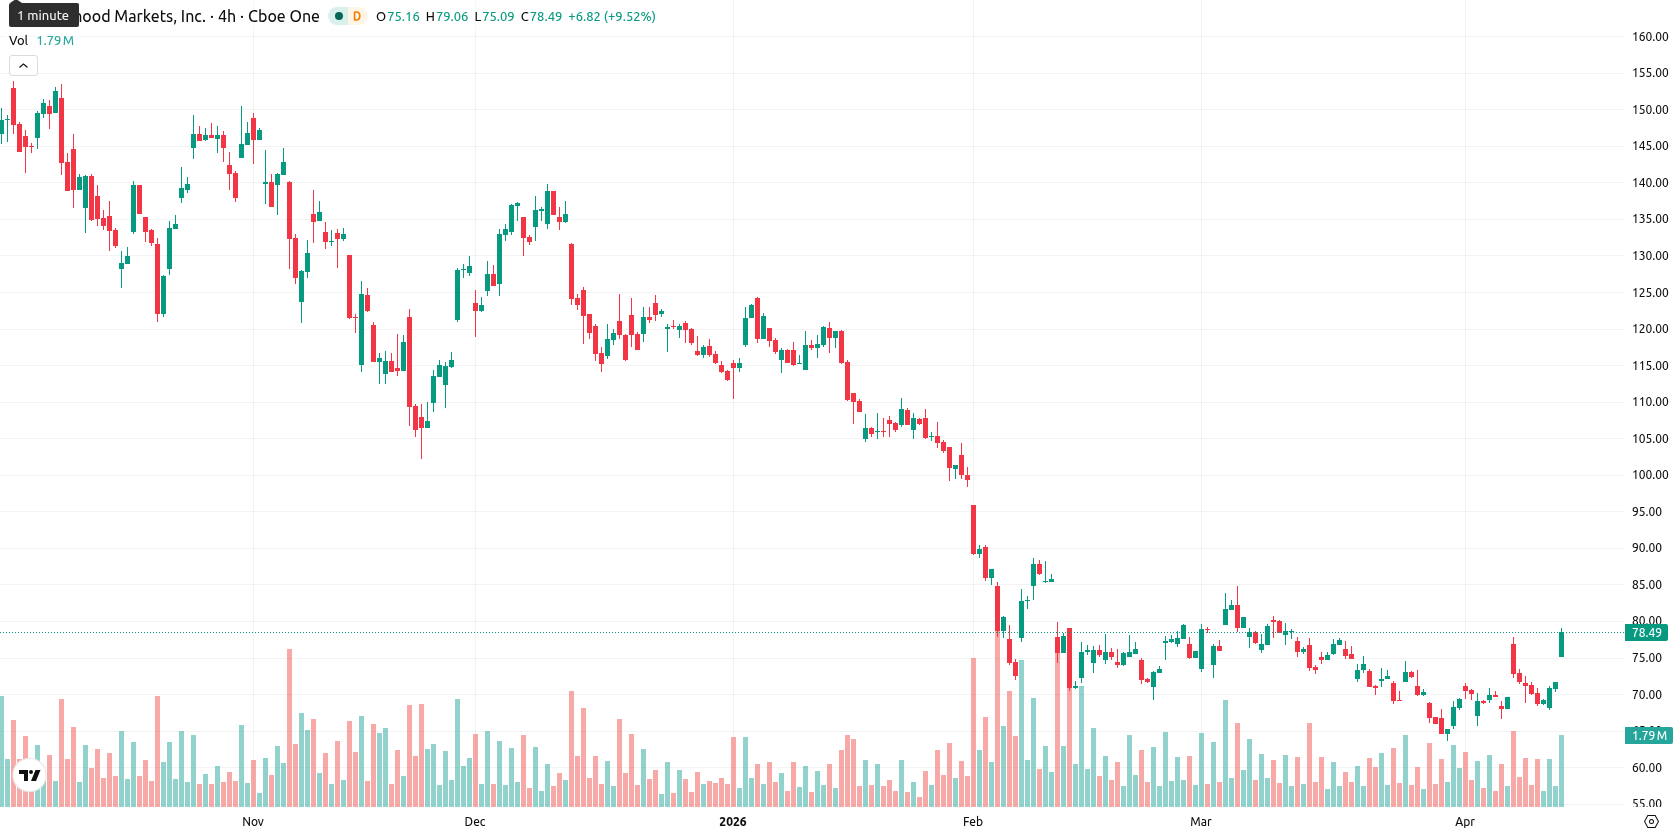
Robinhood Markets Inc (HOOD) is trading at $78.44 today, gaining 9.44% on the session. The stock has moved decisively above the MA-20 ($70.94) and MA-50 ($75.80), while remaining well below the MA-200 ($107.40). This setup signals robust short- and moderate medium-term bullish momentum, but persistent long-term seller pressure. The Ichimoku Kijun at $72.14 acts as immediate support below the current level.
Highlights
- Robinhood tightened access to prediction market contracts, responding to concerns over insider trading and manipulation risks.
- The firm deepened its dependence on payment for order flow revenue while securing a role in administering the Treasury's 'Trump Accounts' child savings initiative alongside BNY Mellon.
- Technicals indicate short-term bullish momentum with elevated volatility, yet momentum signals remain bearish, suggesting HOOD will likely consolidate between $75 and $82 barring a breakout.
Restrictions and contract shifts as Robinhood opens Treasury channel
Robinhood recently imposed restrictions on the number of prediction market contracts available to clients, citing concerns over insider trading and potential manipulation. The company also increased its reliance on payment for order flow revenues compared to more diversified brokerage peers. In addition, Robinhood was selected alongside BNY Mellon to administer the U.S. Treasury’s "Trump Accounts" child savings initiative, opening a new customer channel.
Upward price surge contrasts with persistent bearish momentum signals
Momentum indicators are mixed: the D1 MACD gives a strong sell, while ADX is also bearish, indicating negative momentum despite the session's strong upward move. RSI at 47.64 is neutral to weak, Stoch RSI is overbought, and CCI is neutral. BBP is overbought at 1.14, highlighting intraday buyer dominance. The Awesome Oscillator is neutral, and the session opened with a notable gap up from $71.67 to $75.76. With the price near today’s high of $79.04, volatility is elevated. While buyers have driven prices toward session highs, bearish signals from momentum indicators show a clear divergence with current price action.
Sideways consolidation likely as bearish technical signals persist
Looking ahead to the next five trading days, the expected price range for HOOD falls within $75.00 to $82.00, reflecting a volatility band relative to current levels. The probability of a further price increase is very low (less than 20%), as bearish signals from weekly MA-50, RSI, ADX, and MACD continue to dominate. The base case anticipates a sideways consolidation between $75 and $82. A decisive move above $82 would suggest renewed buyer strength, while a drop below $75 would signal new downside potential.
Previously it was reported that Robinhood remained under prevailing bearish pressure, with negative momentum and technical uncertainty tempering recovery prospects. The current upward move adds a new dimension but, given ongoing mixed signals and heightened volatility, traders should monitor for a potential breakout above $82 or renewed weakness below $75 as confirmation of the next directional move.


Latest Robinhood News


-
 Afghanistan
-
 Albania
-
 Algeria
-
 Angola
-
 Argentina
-
 Armenia
-
 Australia
-
 Austria
-
 Azerbaijan
-
 Bahamas
-
 Bahrain
-
 Bangladesh
-
 Belarus
-
 Belgium
-
 Bolivia
-
 Botswana
-
 Brazil
-
 Brunei
-
 Bulgaria
-
 Cambodia
-
 Cameroon
-
 Canada
-
 Chile
Chile
-
 China
China
-
 Colombia
-
 Congo
Congo
-
 Costa Rica
-
 Cote d'Ivoire
-
 Croatia
-
 Cuba
Cuba
-
 Cyprus
-
 Czechia
-
 DR Congo
-
 Denmark
-
 Dominican Republic
-
 Ecuador
-
 Egypt
Egypt
-
 El Salvador
-
 Estonia
-
 Eswatini
-
 Ethiopia
-
 Finland
-
 France
-
 Georgia
-
 Germany
-
 Ghana
Ghana
-
 Greece
-
 Haiti
Haiti
-
 Hong Kong
-
 Hungary
-
 India
India
-
 Indonesia
-
 Iran, Islamic republic
-
 Iraq
Iraq
-
 Ireland
-
 Israel
-
 Italy
Italy
-
 Jamaica
-
 Japan
Japan
-
 Jordan
-
 Kazakhstan
-
 Kenya
Kenya
-
 Korea
Korea
-
 Kuwait
-
 Kyrgyzstan
-
 Laos
Laos
-
 Latvia
-
 Lebanon
-
 Lesotho
-
 Libya
Libya
-
 Lithuania
-
 Luxembourg
-
 Madagascar
-
 Malaysia
-
 Malta
Malta
-
 Mauritius
-
 Mexico
-
 Moldova
-
 Mongolia
-
 Montenegro
-
 Morocco
-
 Mozambique
-
 Myanmar
-
 Namibia
-
 Nepal
Nepal
-
 Netherlands
-
 New Zealand
-
 Nigeria
-
 North Macedonia
-
 Norway
-
 Oman
Oman
-
 Pakistan
-
 Palestine
-
 Panama
-
 Papua New Guinea
-
 Paraguay
-
 Peru
Peru
-
 Philippines
-
 Poland
-
 Portugal
-
 Puerto Rico
-
 Qatar
Qatar
-
 Reunion
-
 Romania
-
 Rwanda
-
 Saudi Arabia
-
 Serbia
-
 Singapore
-
 Slovakia
-
 Slovenia
-
 Somalia
-
 South Africa
-
 Spain
Spain
-
 Sri Lanka
-
 Sweden
-
 Switzerland
-
 Syria
Syria
-
 Taiwan
-
 Tajikistan
-
 Tanzania
-
 Thailand
-
 Trinidad and Tobago
-
 Tunisia
-
 Turkey
-
 UAE
UAE
-
 Uganda
-
 Ukraine
-
 United Kingdom
-
United States
-
 Uruguay
-
 Uzbekistan
-
 Venezuela
-
 Vietnam
-
 Yemen
Yemen
-
 Zambia
-
 Zimbabwe
- Forex
- Crypto
