

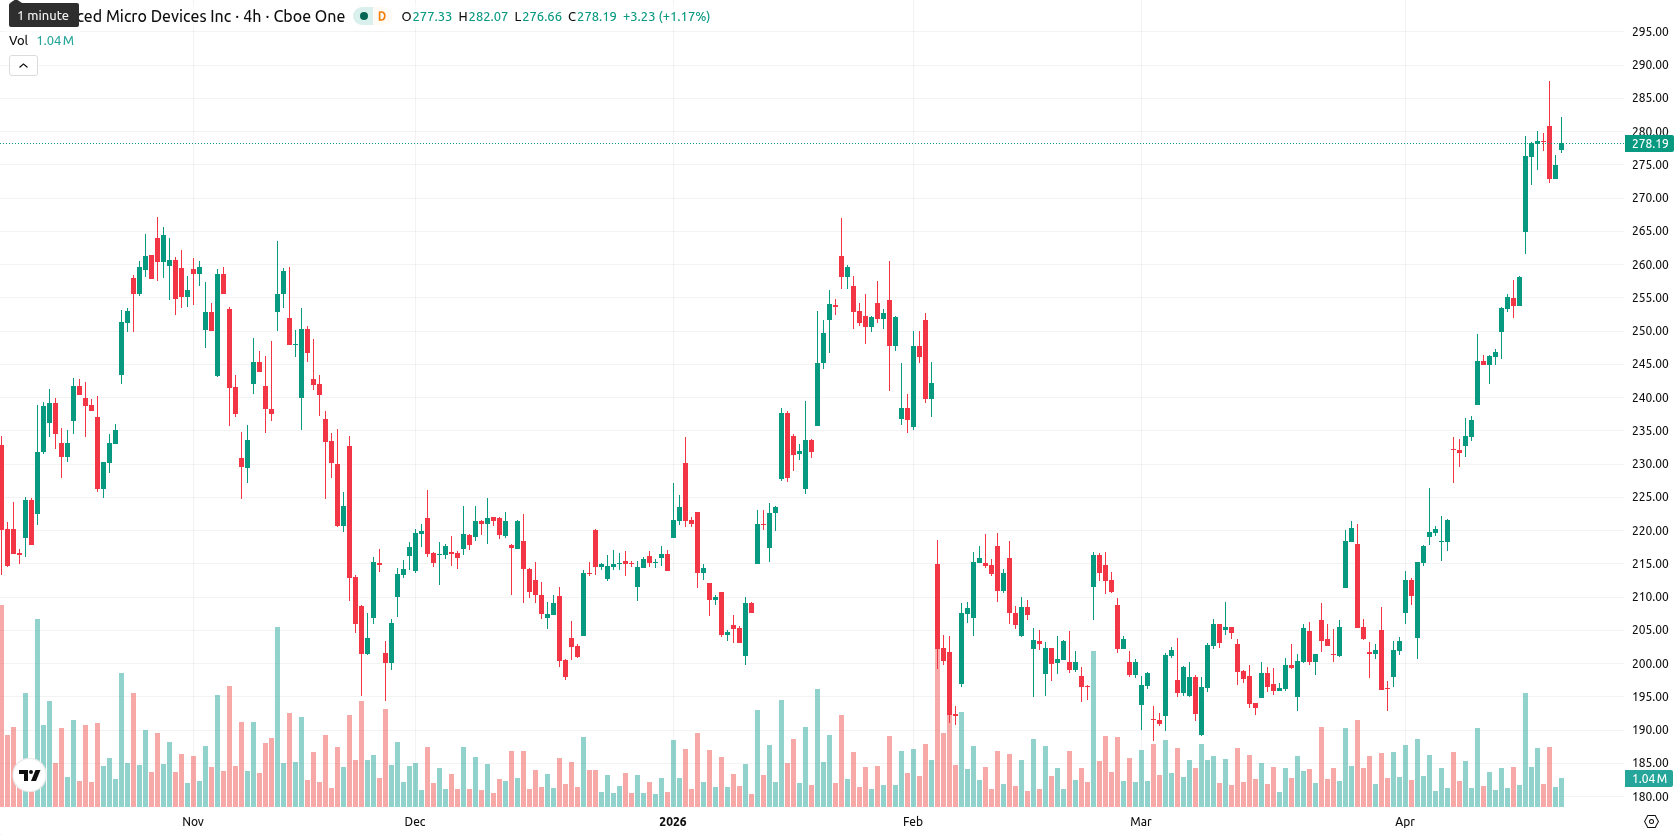
Advanced Micro Devices, Inc. (AMD) is trading at $278.95, posting a daily gain of 1.61%. The price remains well above its key moving averages, indicating strong positive momentum.
Highlights
- AMD trades with strong bullish momentum as price remains well above major moving averages across all time frames.
- Technical indicators show an overbought condition and moderate intraday volatility, increasing the risk of a near-term pullback or sideways consolidation.
- Expected price range for the coming week is $270–$295; breakout above $295 could extend gains, while downside risk is limited unless $270 support breaks.
Overbought signals as price extends beyond technical support
The current price sits $48.58 above the SMA-20 at $230.37, $65.18 above the SMA-50 at $213.77, and $75.82 above the SMA-200 at $203.13. The Ichimoku Kijun level on the daily chart is at $237.19 and provides immediate support. MACD signals remain in buy territory and the ADX is tracking a developing trend, but not a particularly strong one. Oscillators including RSI, Stoch RSI, and CCI indicate overbought conditions, while BBP confirms dominant buyer pressure; the Awesome Oscillator is also positive.
Sideways trend likely as volatility bands limit downside
The typical volatility band for the next week is projected at $270–$295, reflecting recent large-cap movement and centered around current levels. Sideways action is likely between $270 and $295 unless bullish momentum breaks through the upper boundary, in which case a move above $295 may extend the uptrend. A drop below $270 could drive profit taking and test lower supports, but downside risk remains limited based on recent trends.
Previously it was reported that AMD exhibited robust bullish momentum supported by strong technical signals and positive investor sentiment. With the stock now extending further above key moving averages and oscillators showing persistently overbought conditions, traders should closely monitor the $295 level as a potential breakout point for continued upside or signs of exhaustion as volatility remains elevated.


Latest AMD News


-
 Afghanistan
-
 Albania
-
 Algeria
-
 Angola
-
 Argentina
-
 Armenia
-
 Australia
-
 Austria
-
 Azerbaijan
-
 Bahamas
-
 Bahrain
-
 Bangladesh
-
 Belarus
-
 Belgium
-
 Bolivia
-
 Botswana
-
 Brazil
-
 Brunei
-
 Bulgaria
-
 Cambodia
-
 Cameroon
-
 Canada
-
 Chile
Chile
-
 China
China
-
 Colombia
-
 Congo
Congo
-
 Costa Rica
-
 Cote d'Ivoire
-
 Croatia
-
 Cuba
Cuba
-
 Cyprus
-
 Czechia
-
 DR Congo
-
 Denmark
-
 Dominican Republic
-
 Ecuador
-
 Egypt
Egypt
-
 El Salvador
-
 Estonia
-
 Eswatini
-
 Ethiopia
-
 Finland
-
 France
-
 Georgia
-
 Germany
-
 Ghana
Ghana
-
 Greece
-
 Haiti
Haiti
-
 Hong Kong
-
 Hungary
-
 India
India
-
 Indonesia
-
 Iran, Islamic republic
-
 Iraq
Iraq
-
 Ireland
-
 Israel
-
 Italy
Italy
-
 Jamaica
-
 Japan
Japan
-
 Jordan
-
 Kazakhstan
-
 Kenya
Kenya
-
 Korea
Korea
-
 Kuwait
-
 Kyrgyzstan
-
 Laos
Laos
-
 Latvia
-
 Lebanon
-
 Lesotho
-
 Libya
Libya
-
 Lithuania
-
 Luxembourg
-
 Madagascar
-
 Malaysia
-
 Malta
Malta
-
 Mauritius
-
 Mexico
-
 Moldova
-
 Mongolia
-
 Montenegro
-
 Morocco
-
 Mozambique
-
 Myanmar
-
 Namibia
-
 Nepal
Nepal
-
 Netherlands
-
 New Zealand
-
 Nigeria
-
 North Macedonia
-
 Norway
-
 Oman
Oman
-
 Pakistan
-
 Palestine
-
 Panama
-
 Papua New Guinea
-
 Paraguay
-
 Peru
Peru
-
 Philippines
-
 Poland
-
 Portugal
-
 Puerto Rico
-
 Qatar
Qatar
-
 Reunion
-
 Romania
-
 Rwanda
-
 Saudi Arabia
-
 Serbia
-
 Singapore
-
 Slovakia
-
 Slovenia
-
 Somalia
-
 South Africa
-
 Spain
Spain
-
 Sri Lanka
-
 Sweden
-
 Switzerland
-
 Syria
Syria
-
 Taiwan
-
 Tajikistan
-
 Tanzania
-
 Thailand
-
 Trinidad and Tobago
-
 Tunisia
-
 Turkey
-
 UAE
UAE
-
 Uganda
-
 Ukraine
-
 United Kingdom
-
United States
-
 Uruguay
-
 Uzbekistan
-
 Venezuela
-
 Vietnam
-
 Yemen
Yemen
-
 Zambia
-
 Zimbabwe
- Forex
- Crypto
