
O'Reilly Automotive stock moves lower as negative return on equity raises capital structure concerns

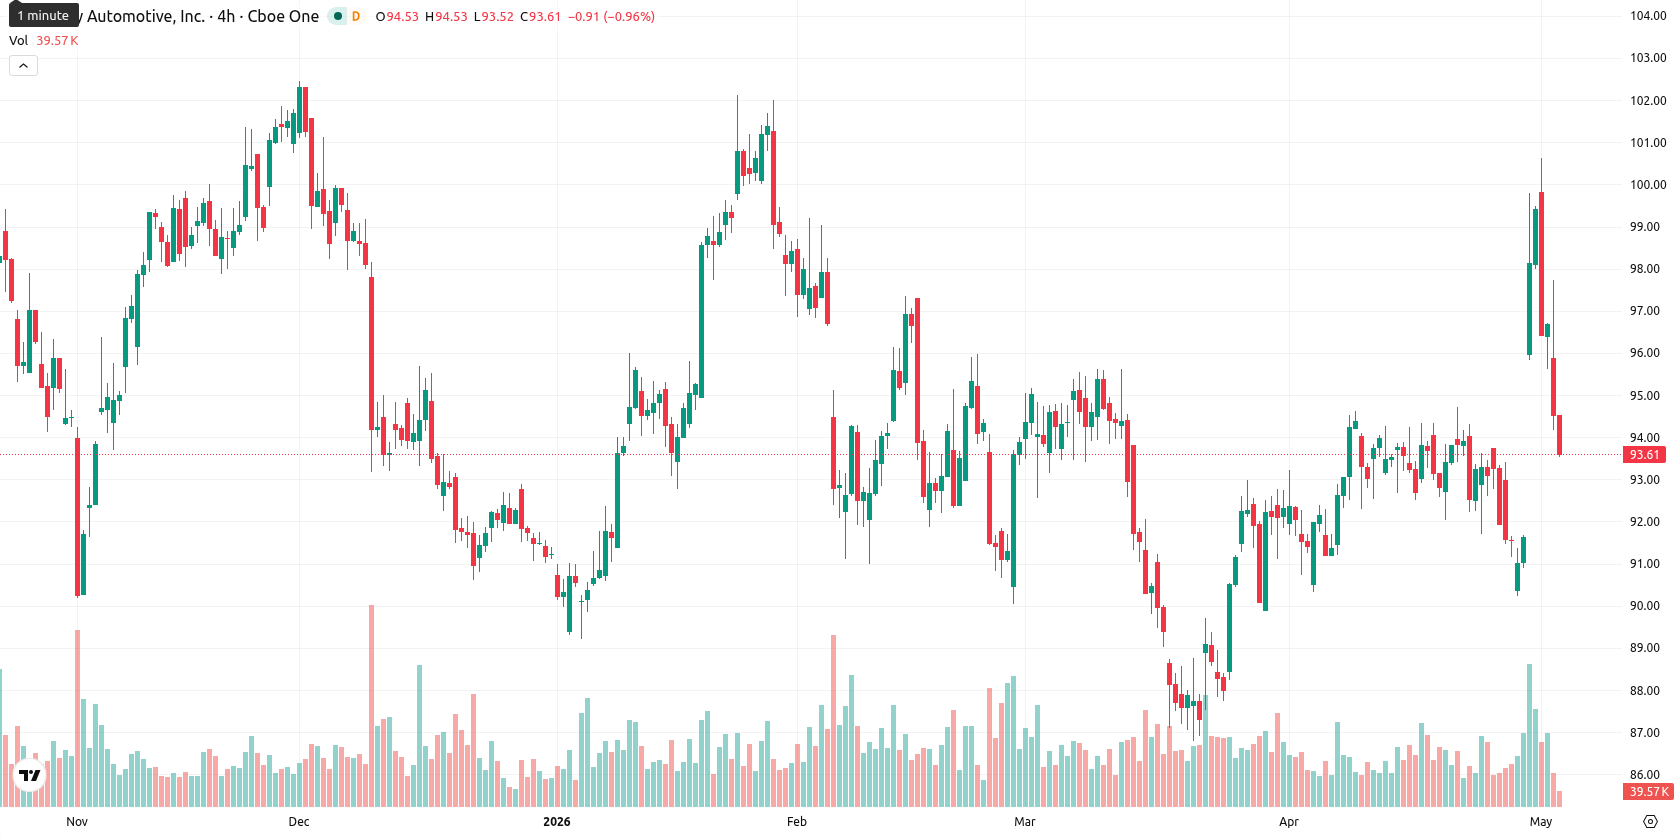
O'Reilly Automotive, Inc. (ORLY) is trading at $93.55, down 3.21% on the day. The price is currently positioned just above its short- and medium-term moving averages, while remaining well below its longer-term average.
Highlights
- O'Reilly Automotive delivered quarterly EPS of $0.72 and revenue of $4.56 billion, beating estimates and growing 10.2% year-over-year.
- Institutional demand increased as PFA Pension Forsikringsaktieselskab acquired 622,889 shares, but the company reported a negative return on equity of 263.22%.
- Technicals indicate choppy trading between $92.00 and $96.20, with weak momentum and a higher probability of further downside.
Earnings beat and institutional buying counter sustained market selling
O'Reilly Automotive reported quarterly earnings on April 29, posting $0.72 per share and surpassing the consensus estimate by $0.03, reflecting operational outperformance. Revenue for the quarter reached $4.56 billion, representing a 10.2% year-over-year increase and also exceeding analyst expectations. Additional context comes from PFA Pension Forsikringsaktieselskab acquiring 622,889 shares during the fourth quarter, introducing increased institutional demand, while the company reported a net margin of 14.30% and a negative return on equity of 263.22%, though price action has remained under broader selling pressure.
Mixed technical momentum as price nears key resistance levels
The SMA-20 is at $93.49 and the SMA-50 is at $92.62, both lying just below the current price, while the SMA-200 at $97.26 remains a notable resistance level above. The Ichimoku Kijun sits at $95.18, marking immediate resistance, and intraday price has ranged between $93.95 and $97.70 following a minor gap down. Momentum signals are mixed: the daily MACD is bullish and the RSI stands at 59, also favoring further upside, but the ADX at 10.81 implies only a weak underlying trend. Meanwhile, both the CCI and Bull/Bear Power (BBP) are overbought, signaling buyer control but possible exhaustion, while Stoch RSI is neutral and the Awesome Oscillator (AO) supports the existing bullish tendency on higher timeframes, with intraday momentum notably weaker.
Bearish bias persists as limited upside meets volatility constraints
For the next five sessions, ORLY is expected to trade within a typical volatility band defined by $92.00 to $96.20. The probability of a price increase is calculated at less than 20%, making a further downside move more likely. The baseline scenario is for the price to move sideways within this corridor. If a bullish breakout occurs above the $95.18 Kijun resistance, upward movement toward the $96.20 level is possible, while a sustained drop below $92.00 would open the door to further declines toward medium-term support.
Earlier, analysts noted that O'Reilly Automotive was facing persistent selling pressure despite increased institutional interest, with technical signals pointing to potential downside risk. The latest earnings outperformance and continued mixed momentum indicators reinforce caution, making the $92.00 support level a critical threshold to monitor for a possible shift in trend.


Latest O’Reilly Automotive News


-
 Afghanistan
-
 Albania
-
 Algeria
-
 Angola
-
 Argentina
-
 Armenia
-
 Australia
-
 Austria
-
 Azerbaijan
-
 Bahamas
-
 Bahrain
-
 Bangladesh
-
 Belarus
-
 Belgium
-
 Bolivia
-
 Botswana
-
 Brazil
-
 Brunei
-
 Bulgaria
-
 Cambodia
-
 Cameroon
-
 Canada
-
 Chile
Chile
-
 China
China
-
 Colombia
-
 Congo
Congo
-
 Costa Rica
-
 Cote d'Ivoire
-
 Croatia
-
 Cuba
Cuba
-
 Cyprus
-
 Czechia
-
 DR Congo
-
 Denmark
-
 Dominican Republic
-
 Ecuador
-
 Egypt
Egypt
-
 El Salvador
-
 Estonia
-
 Eswatini
-
 Ethiopia
-
 Finland
-
 France
-
 Georgia
-
 Germany
-
 Ghana
Ghana
-
 Greece
-
 Haiti
Haiti
-
 Hong Kong
-
 Hungary
-
 India
India
-
 Indonesia
-
 Iran, Islamic republic
-
 Iraq
Iraq
-
 Ireland
-
 Israel
-
 Italy
Italy
-
 Jamaica
-
 Japan
Japan
-
 Jordan
-
 Kazakhstan
-
 Kenya
Kenya
-
 Korea
Korea
-
 Kuwait
-
 Kyrgyzstan
-
 Laos
Laos
-
 Latvia
-
 Lebanon
-
 Lesotho
-
 Libya
Libya
-
 Lithuania
-
 Luxembourg
-
 Madagascar
-
 Malaysia
-
 Malta
Malta
-
 Mauritius
-
 Mexico
-
 Moldova
-
 Mongolia
-
 Montenegro
-
 Morocco
-
 Mozambique
-
 Myanmar
-
 Namibia
-
 Nepal
Nepal
-
 Netherlands
-
 New Zealand
-
 Nigeria
-
 North Macedonia
-
 Norway
-
 Oman
Oman
-
 Pakistan
-
 Palestine
-
 Panama
-
 Papua New Guinea
-
 Paraguay
-
 Peru
Peru
-
 Philippines
-
 Poland
-
 Portugal
-
 Puerto Rico
-
 Qatar
Qatar
-
 Reunion
-
 Romania
-
 Rwanda
-
 Saudi Arabia
-
 Serbia
-
 Singapore
-
 Slovakia
-
 Slovenia
-
 Somalia
-
 South Africa
-
 Spain
Spain
-
 Sri Lanka
-
 Sweden
-
 Switzerland
-
 Syria
Syria
-
 Taiwan
-
 Tajikistan
-
 Tanzania
-
 Thailand
-
 Trinidad and Tobago
-
 Tunisia
-
 Turkey
-
 UAE
UAE
-
 Uganda
-
 Ukraine
-
 United Kingdom
-
United States
-
 Uruguay
-
 Uzbekistan
-
 Venezuela
-
 Vietnam
-
 Yemen
Yemen
-
 Zambia
-
 Zimbabwe
- Forex
- Crypto
