
Qualcomm stock price forecast: $186.76 support as QCOM drops 4.58%

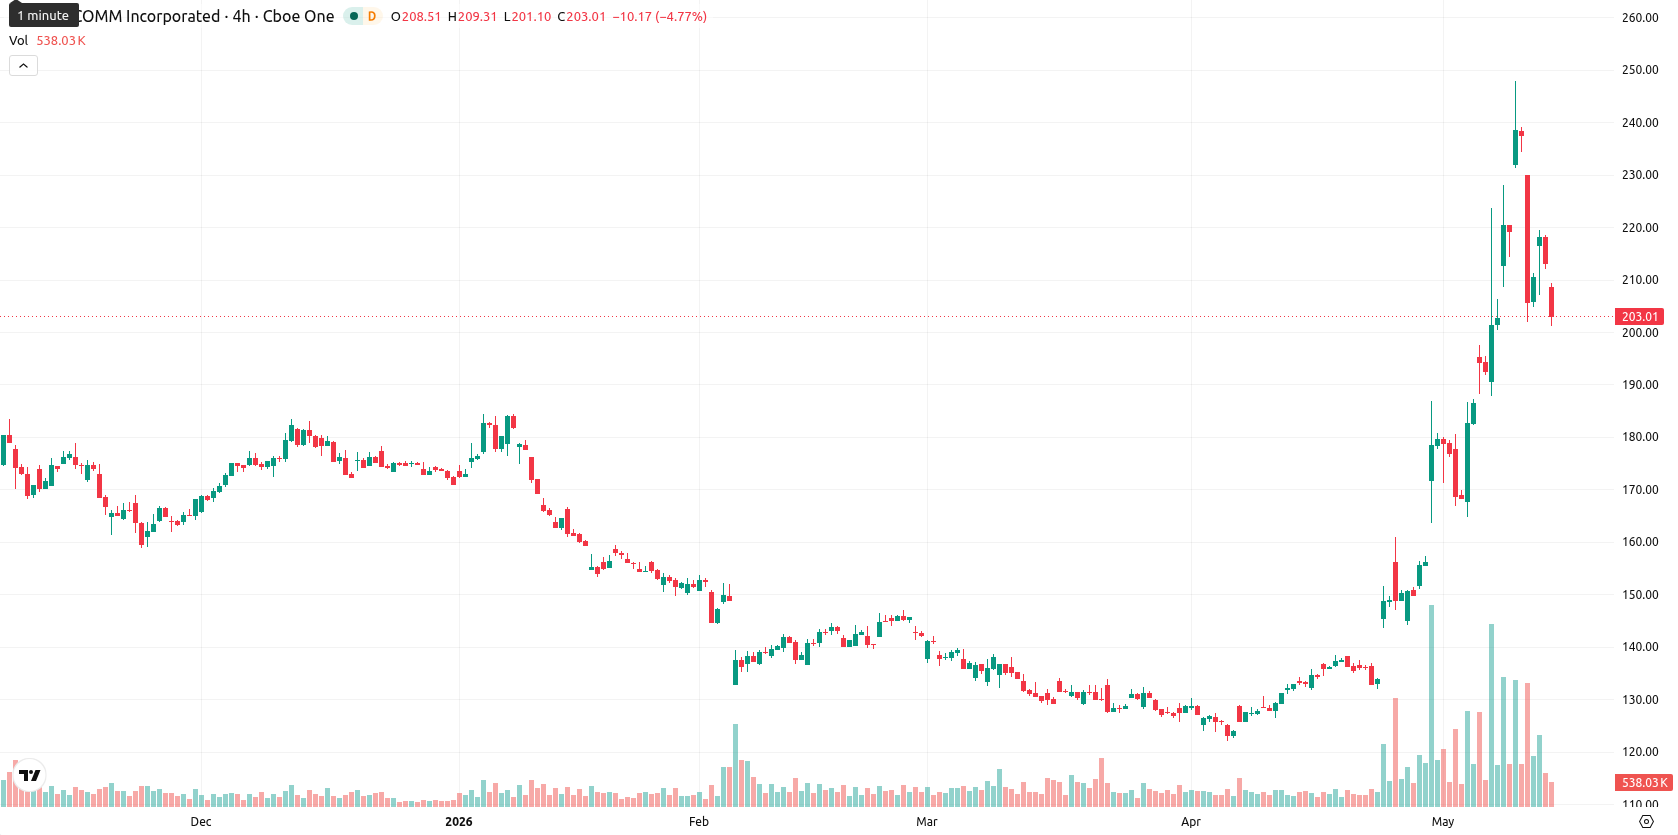
Qualcomm Incorporated (QCOM) is trading at $203.41, reflecting a 4.58% decline for the day. The price remains well above its key short-, medium-, and long-term moving averages, signaling robust longer-term momentum despite today's reversal.
Highlights
- Qualcomm delivered strong Q2 results, with improved execution and expansion into data center processors supporting long-term growth prospects.
- The suspension of US-China tariffs on Qualcomm products reduced costs and boosted the firm's supply chain flexibility.
- Shares trade in a bullish longer-term structure but face short-term downside pressure, with expected consolidation between $195.00 and $210.00.
Earnings strength and tariff reprieve offset by persistent sell pressure
Qualcomm reported strong fiscal second-quarter results, illustrating improved operational execution and underpinning its fundamental positioning. Progress in the company's data center processor segment expanded its product reach and added a diversification lever to future earnings. The recent suspension of US-China tariffs on Qualcomm products directly reduced cross-border costs and improved supply chain flexibility. Several institutional investors were also reported to have increased or adjusted their holdings during the fourth quarter, though price action has remained under broader selling pressure.
Technical resilience above support as mixed indicators hint at exhaustion
QCOM maintains a substantial cushion above the D1 MA-20 ($170.47), MA-50 ($146.56), and MA-200 ($158.58). The Ichimoku Kijun level, now at $186.76, serves as immediate support. Technical momentum indicators are mixed: while the ADX and MACD signal ongoing positive trend strength, overbought conditions are apparent on both the daily RSI at 69 and the CCI, with the Stoch RSI reflecting oversold levels. The Bull/Bear Power indicator currently suggests overbought circumstances, and intraday action points to rising seller pressure, with the price trading just above today's low after a sharp gap down at the open.
Sideways outlook holds unless breakout or breach deepens volatility
Over the next five trading days, QCOM's typical volatility band relative to current levels is projected between $195.00 and $210.00. There is a moderate probability (75%) of a further upside move, while sustained downside is less likely. The baseline scenario involves price consolidating sideways within this corridor. Should the price break above $210.00, renewed buying could push it toward the upper range; a fall below $195.00, however, may expose the stock to further selling pressure and a deeper pullback, despite generally supportive longer-term signals.
Previously it was reported that Qualcomm's uptrend was showing signs of overbought exhaustion, with analysts urging caution amid heightened volatility. While the current backdrop maintains longer-term momentum, traders should watch for decisive price action above $210.00 for renewed upside or sustained moves below $195.00 as a potential downside risk in the days ahead.


-
 Afghanistan
-
 Albania
-
 Algeria
-
 Angola
-
 Argentina
-
 Armenia
-
 Australia
-
 Austria
-
 Azerbaijan
-
 Bahamas
-
 Bahrain
-
 Bangladesh
-
 Belarus
-
 Belgium
-
 Bolivia
-
 Botswana
-
 Brazil
-
 Brunei
-
 Bulgaria
-
 Cambodia
-
 Cameroon
-
 Canada
-
 Chile
Chile
-
 China
China
-
 Colombia
-
 Congo
Congo
-
 Costa Rica
-
 Cote d'Ivoire
-
 Croatia
-
 Cuba
Cuba
-
 Cyprus
-
 Czechia
-
 DR Congo
-
 Denmark
-
 Dominican Republic
-
 Ecuador
-
 Egypt
Egypt
-
 El Salvador
-
 Estonia
-
 Eswatini
-
 Ethiopia
-
 Finland
-
 France
-
 Georgia
-
 Germany
-
 Ghana
Ghana
-
 Greece
-
 Haiti
Haiti
-
 Hong Kong
-
 Hungary
-
 India
India
-
 Indonesia
-
 Iran, Islamic republic
-
 Iraq
Iraq
-
 Ireland
-
 Israel
-
 Italy
Italy
-
 Jamaica
-
 Japan
Japan
-
 Jordan
-
 Kazakhstan
-
 Kenya
Kenya
-
 Korea
Korea
-
 Kuwait
-
 Kyrgyzstan
-
 Laos
Laos
-
 Latvia
-
 Lebanon
-
 Lesotho
-
 Libya
Libya
-
 Lithuania
-
 Luxembourg
-
 Madagascar
-
 Malaysia
-
 Malta
Malta
-
 Mauritius
-
 Mexico
-
 Moldova
-
 Mongolia
-
 Montenegro
-
 Morocco
-
 Mozambique
-
 Myanmar
-
 Namibia
-
 Nepal
Nepal
-
 Netherlands
-
 New Zealand
-
 Nigeria
-
 North Macedonia
-
 Norway
-
 Oman
Oman
-
 Pakistan
-
 Palestine
-
 Panama
-
 Papua New Guinea
-
 Paraguay
-
 Peru
Peru
-
 Philippines
-
 Poland
-
 Portugal
-
 Puerto Rico
-
 Qatar
Qatar
-
 Reunion
-
 Romania
-
 Rwanda
-
 Saudi Arabia
-
 Serbia
-
 Singapore
-
 Slovakia
-
 Slovenia
-
 Somalia
-
 South Africa
-
 Spain
Spain
-
 Sri Lanka
-
 Sweden
-
 Switzerland
-
 Syria
Syria
-
 Taiwan
-
 Tajikistan
-
 Tanzania
-
 Thailand
-
 Trinidad and Tobago
-
 Tunisia
-
 Turkey
-
 UAE
UAE
-
 Uganda
-
 Ukraine
-
 United Kingdom
-
United States
-
 Uruguay
-
 Uzbekistan
-
 Venezuela
-
 Vietnam
-
 Yemen
Yemen
-
 Zambia
-
 Zimbabwe
- Forex
- Crypto
