
Model Y price reduction drags Tesla stock down 2.78% on Tuesday

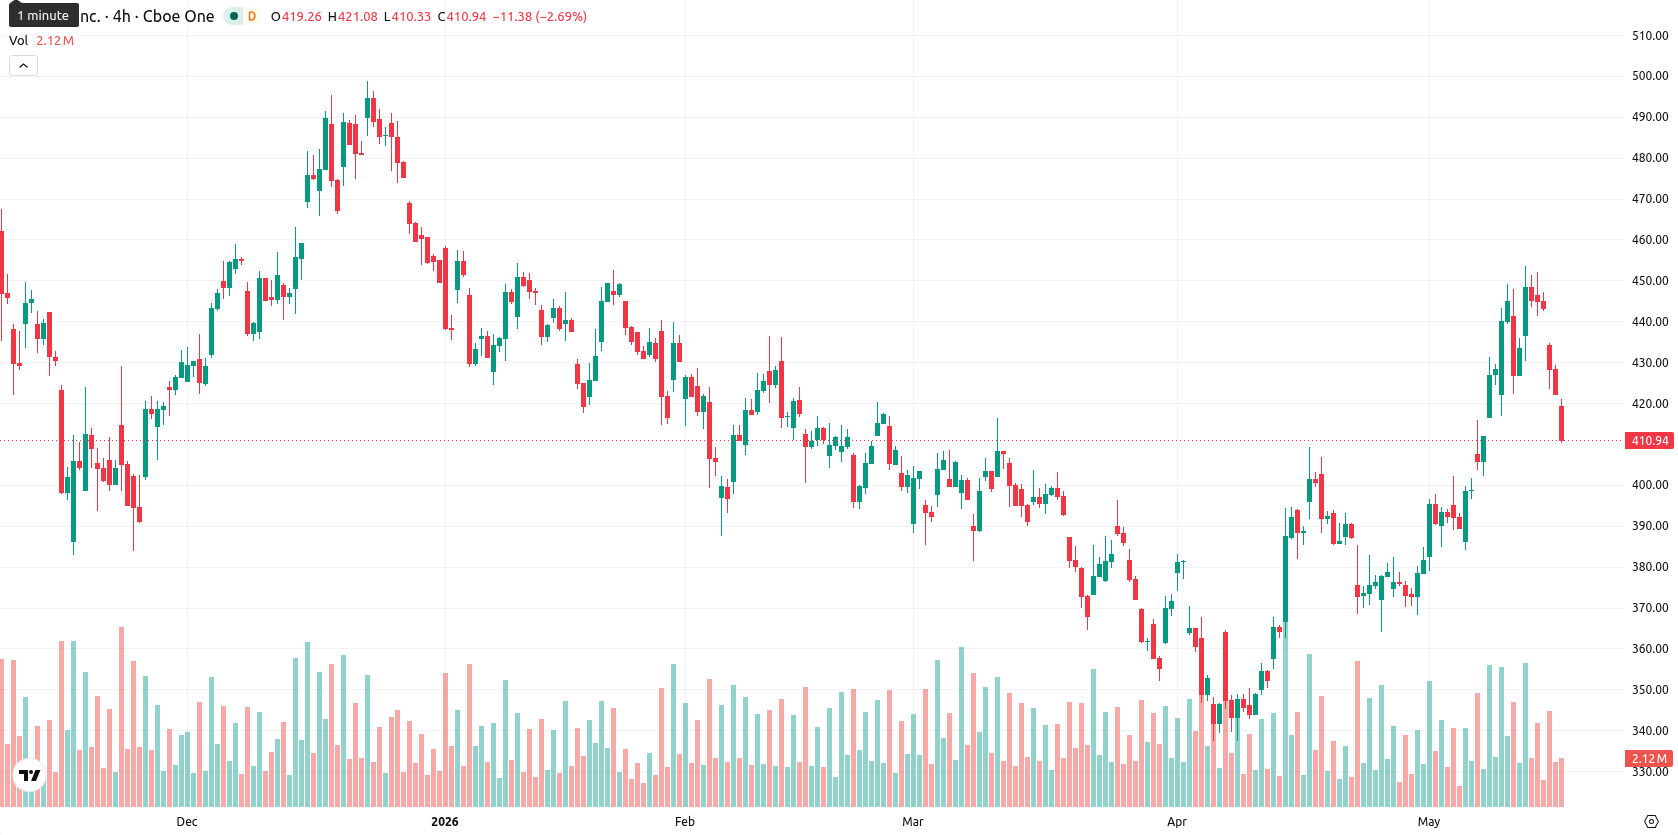
Tesla, Inc. (TSLA) is trading at $410.25 after a daily drop of 2.78%. The stock remains slightly above its key moving averages, despite ongoing intraday volatility.
Highlights
- Tesla's CFO sold 3,000 shares for $1,350,000, signaling reduced insider accumulation and increasing available float.
- Tesla launched a major Full Self-Driving software update and implemented the first U.S. Model Y price change in two years, impacting demand and innovation narrative.
- TSLA trades with mixed momentum signals amid volatility, expected to remain in the $400–$426 range, with downside risk if $400 support fails.
Insider sales, FSD update, and Model Y price shift alter sentiment
Tesla's CFO Vaibhav Taneja completed an insider transaction on May 18, 2026, selling 3,000 shares for $1,350,000, which increased the available float and may be viewed by the market as a signal of reduced insider accumulation. The company rolled out a new Full Self-Driving software update, introducing version 2026.14.6.6 that adds features such as FSD V14.3.3 and raises the top speed of Actually Smart Summon, reflecting ongoing product innovation. Tesla also adjusted Model Y pricing in the United States for the first time in two years, potentially affecting domestic demand, while recent hedge fund filings indicate mixed institutional flows through both increased and reduced share holdings.
Technical boundaries hold as indicators show mixed momentum and weak trend
TSLA is hovering just above key technical levels, including the SMA-20 at $401.28, SMA-50 at $386.77, and SMA-200 at $407.39. The Ichimoku Kijun (D1) level at $398.08 provides immediate support, with the recent intraday low aligning near this zone. Momentum indicators show a mixed pattern: MACD (D1) remains in buy territory, but the ADX reading is low at 18.53, signaling weak trend strength. Oscillators such as RSI (D1) at 57.86 and CCI at 72.81 reflect neutral to moderately bullish conditions, while the Stoch RSI at 39.71 is also neutral. BBP flags overbought conditions, yet Awesome Oscillator and Stoch RSI highlight short-term weakness and developing divergence as sellers have shown increasing activity during the session.
Limited rebound potential as volatility range constrains short-term outlook
In the short term, TSLA is expected to trade within a volatility band of $400.00 to $426.00, consistent with recent high fluctuations. There is a low probability of a sustained price recovery in the near term, with upside potential limited unless buying interest resumes and resistance levels are decisively overtaken. The baseline scenario calls for stabilization within the $400–$426 range; however, if TSLA fails to hold above the $400 support, the price may retreat toward the mid-$390s.
Earlier, analysts noted that Tesla faced rising legal and regulatory headwinds alongside technical signals of short-term downside risks. The current environment adds uncertainty with mixed institutional flows and insider selling, making the $400 support level a critical threshold for traders to monitor for decisive near-term direction.


-
 Afghanistan
-
 Albania
-
 Algeria
-
 Angola
-
 Argentina
-
 Armenia
-
 Australia
-
 Austria
-
 Azerbaijan
-
 Bahamas
-
 Bahrain
-
 Bangladesh
-
 Belarus
-
 Belgium
-
 Bolivia
-
 Botswana
-
 Brazil
-
 Brunei
-
 Bulgaria
-
 Cambodia
-
 Cameroon
-
 Canada
-
 Chile
Chile
-
 China
China
-
 Colombia
-
 Congo
Congo
-
 Costa Rica
-
 Cote d'Ivoire
-
 Croatia
-
 Cuba
Cuba
-
 Cyprus
-
 Czechia
-
 DR Congo
-
 Denmark
-
 Dominican Republic
-
 Ecuador
-
 Egypt
Egypt
-
 El Salvador
-
 Estonia
-
 Eswatini
-
 Ethiopia
-
 Finland
-
 France
-
 Georgia
-
 Germany
-
 Ghana
Ghana
-
 Greece
-
 Haiti
Haiti
-
 Hong Kong
-
 Hungary
-
 India
India
-
 Indonesia
-
 Iran, Islamic republic
-
 Iraq
Iraq
-
 Ireland
-
 Israel
-
 Italy
Italy
-
 Jamaica
-
 Japan
Japan
-
 Jordan
-
 Kazakhstan
-
 Kenya
Kenya
-
 Korea
Korea
-
 Kuwait
-
 Kyrgyzstan
-
 Laos
Laos
-
 Latvia
-
 Lebanon
-
 Lesotho
-
 Libya
Libya
-
 Lithuania
-
 Luxembourg
-
 Madagascar
-
 Malaysia
-
 Malta
Malta
-
 Mauritius
-
 Mexico
-
 Moldova
-
 Mongolia
-
 Montenegro
-
 Morocco
-
 Mozambique
-
 Myanmar
-
 Namibia
-
 Nepal
Nepal
-
 Netherlands
-
 New Zealand
-
 Nigeria
-
 North Macedonia
-
 Norway
-
 Oman
Oman
-
 Pakistan
-
 Palestine
-
 Panama
-
 Papua New Guinea
-
 Paraguay
-
 Peru
Peru
-
 Philippines
-
 Poland
-
 Portugal
-
 Puerto Rico
-
 Qatar
Qatar
-
 Reunion
-
 Romania
-
 Rwanda
-
 Saudi Arabia
-
 Serbia
-
 Singapore
-
 Slovakia
-
 Slovenia
-
 Somalia
-
 South Africa
-
 Spain
Spain
-
 Sri Lanka
-
 Sweden
-
 Switzerland
-
 Syria
Syria
-
 Taiwan
-
 Tajikistan
-
 Tanzania
-
 Thailand
-
 Trinidad and Tobago
-
 Tunisia
-
 Turkey
-
 UAE
UAE
-
 Uganda
-
 Ukraine
-
 United Kingdom
-
United States
-
 Uruguay
-
 Uzbekistan
-
 Venezuela
-
 Vietnam
-
 Yemen
Yemen
-
 Zambia
-
 Zimbabwe
- Forex
- Crypto
