
Intuit stock slides as bearish momentum dominates and moving averages cap upside: weekly outlook

Intuit Inc. (INTU) now trades at $311.73, representing a loss of $8.10 or 2.77% over the past week. The stock remains well below its weekly MA-20 at $437.48, MA-50 at $592.96, and MA-200 at $556.97, highlighting sustained weakness and a firm bearish trend on the weekly chart.
 283.44
283.44
283.44
Highlights
- Intuit trades well below major moving averages, marking a pronounced bearish trend in both medium- and long-term timeframes.
- Momentum indicators, including MACD, ADX, and Stochastic RSI, confirm strong downside pressure with pronounced oversold signals.
- The next 7-day trading range is projected between $305 and $325, with a clear risk of further declines if support breaks.
Restructuring and AI pivot drive sentiment amid TurboTax and legal concerns
Intuit announced a major restructuring with a 17% reduction in its global workforce, affecting approximately 3,000 employees, as it pivots to integrate artificial intelligence across its core products. The company is consolidating its operations by closing offices in Reno, Nevada, and Woodland Hills, California. Despite stronger revenue and earnings results in the third quarter, concerns have grown over TurboTax’s performance and competition. Investigations have also been launched into potential securities fraud related to public statements on TurboTax pricing strategies for the 2026 tax season.
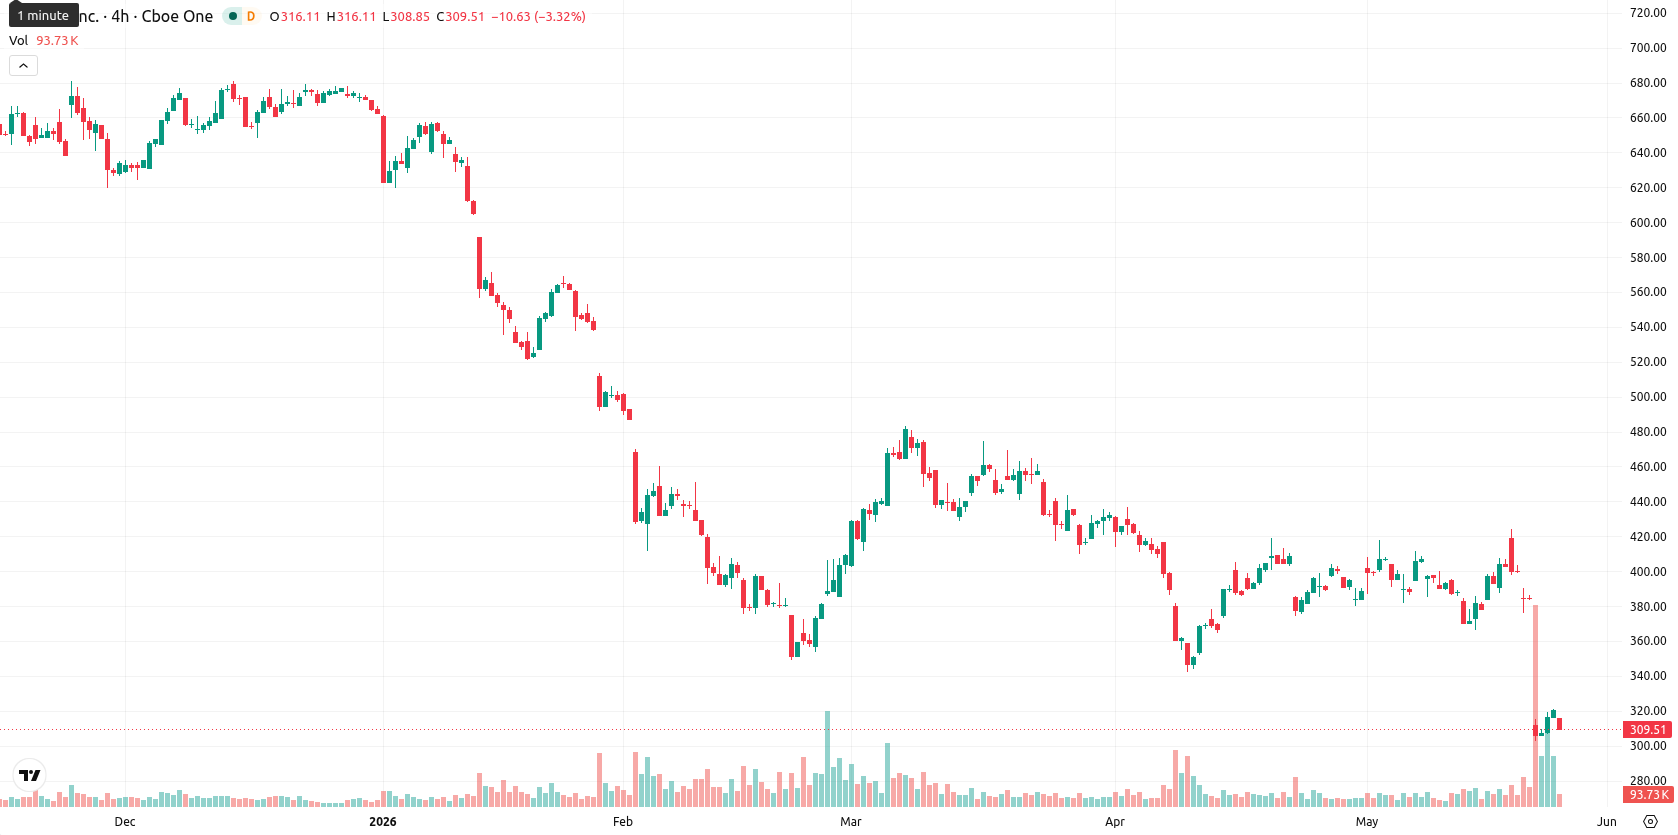
Persistent bearish momentum and oversold signals define weekly technical outlook
Momentum signals on the weekly timeframe remain decisively negative, with both MACD and ADX indicating strong downside pressure. The RSI and Commodity Channel Index reflect oversold conditions, while the Stochastic RSI points to a strong sell. INTU is trading at the bottom of its weekly range, beneath all major moving averages (MA-20, MA-50, MA-200), which now act as dynamic resistance. Volatility remains elevated at 29.15%, and key weekly support is at $305, with resistance near $325.
Sideways bias expected next week as momentum favors further downside
Looking ahead to the next 5 trading days, INTU is likely to move sideways between $305 and $325, as no technical indicators currently suggest a buying opportunity. There is less than a 20% probability of a sustained rebound, and a further decline is more probable if momentum persists. A close below $305 would signal increased downside risk, while only a clear break above $325 could tilt the bias slightly more positive in the short term. The primary scenario calls for continued consolidation within the stated range barring any unexpected news catalysts.
Previously it was reported that Intuit faced persistent bearish momentum despite restructuring measures, with technicals signaling continued weakness. This week’s renewed downside, ongoing oversold signals, and heightened volatility further reinforce the negative trend, making a breakdown below the $305 support a key risk for traders to monitor in the days ahead.














-
 Afghanistan
-
 Albania
-
 Algeria
-
 Angola
-
 Argentina
-
 Armenia
-
 Australia
-
 Austria
-
 Azerbaijan
-
 Bahamas
-
 Bahrain
-
 Bangladesh
-
 Belarus
-
 Belgium
-
 Bolivia
-
 Botswana
-
 Brazil
-
 Brunei
-
 Bulgaria
-
 Cambodia
-
 Cameroon
-
 Canada
-
 Chile
Chile
-
 China
China
-
 Colombia
-
 Congo
Congo
-
 Costa Rica
-
 Cote d'Ivoire
-
 Croatia
-
 Cuba
Cuba
-
 Cyprus
-
 Czechia
-
 DR Congo
-
 Denmark
-
 Dominican Republic
-
 Ecuador
-
 Egypt
Egypt
-
 El Salvador
-
 Estonia
-
 Eswatini
-
 Ethiopia
-
 Finland
-
 France
-
 Georgia
-
 Germany
-
 Ghana
Ghana
-
 Greece
-
 Haiti
Haiti
-
 Hong Kong
-
 Hungary
-
 India
India
-
 Indonesia
-
 Iran, Islamic republic
-
 Iraq
Iraq
-
 Ireland
-
 Israel
-
 Italy
Italy
-
 Jamaica
-
 Japan
Japan
-
 Jordan
-
 Kazakhstan
-
 Kenya
Kenya
-
 Korea
Korea
-
 Kuwait
-
 Kyrgyzstan
-
 Laos
Laos
-
 Latvia
-
 Lebanon
-
 Lesotho
-
 Libya
Libya
-
 Lithuania
-
 Luxembourg
-
 Madagascar
-
 Malaysia
-
 Malta
Malta
-
 Mauritius
-
 Mexico
-
 Moldova
-
 Mongolia
-
 Montenegro
-
 Morocco
-
 Mozambique
-
 Myanmar
-
 Namibia
-
 Nepal
Nepal
-
 Netherlands
-
 New Zealand
-
 Nigeria
-
 North Macedonia
-
 Norway
-
 Oman
Oman
-
 Pakistan
-
 Palestine
-
 Panama
-
 Papua New Guinea
-
 Paraguay
-
 Peru
Peru
-
 Philippines
-
 Poland
-
 Portugal
-
 Puerto Rico
-
 Qatar
Qatar
-
 Reunion
-
 Romania
-
 Rwanda
-
 Saudi Arabia
-
 Serbia
-
 Singapore
-
 Slovakia
-
 Slovenia
-
 Somalia
-
 South Africa
-
 Spain
Spain
-
 Sri Lanka
-
 Sweden
-
 Switzerland
-
 Syria
Syria
-
 Taiwan
-
 Tajikistan
-
 Tanzania
-
 Thailand
-
 Trinidad and Tobago
-
 Tunisia
-
 Turkey
-
 UAE
UAE
-
 Uganda
-
 Ukraine
-
 United Kingdom
-
United States
-
 Uruguay
-
 Uzbekistan
-
 Venezuela
-
 Vietnam
-
 Yemen
Yemen
-
 Zambia
-
 Zimbabwe
- Forex
- Crypto











