
Interactive Brokers stock climbs as intraday buying pushes price near session highs

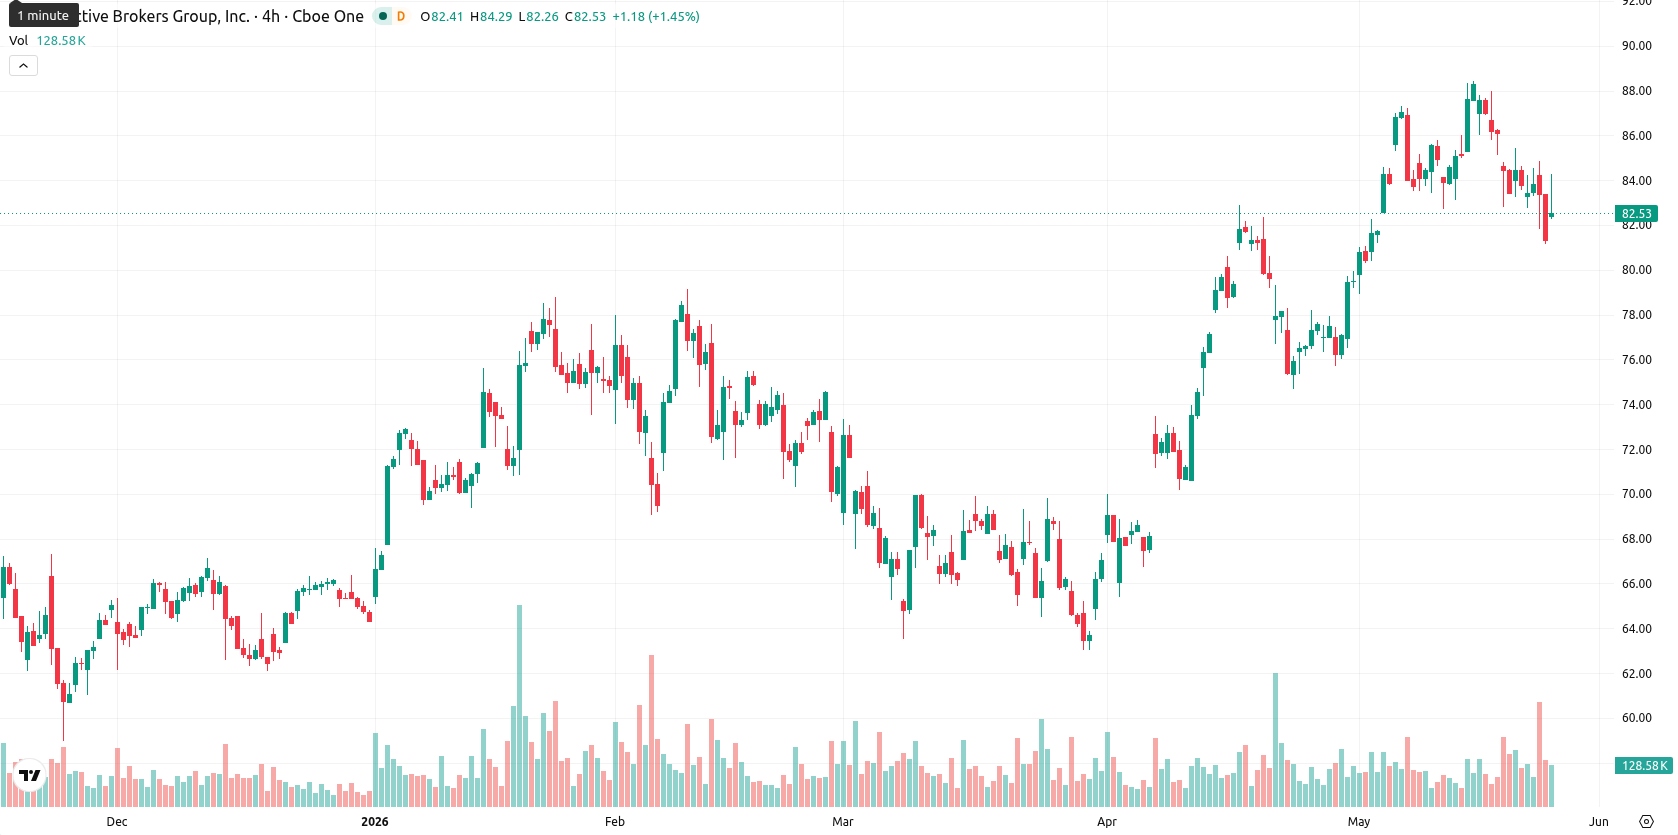
Interactive Brokers Group, Inc. (IBKR) stock is trading at $83.97, up 3.22% on the day. The current price sits above its key moving averages, indicating broad strength relative to both short- and long-term reference levels.
Highlights
- IBKR maintains a bullish technical structure, with price holding above key moving averages and immediate support at $81.53.
- Bullish momentum indicators dominate, but oscillators show mixed signals with overbought and short-term exhaustion conditions emerging.
- Expected range for the next five days is $81.69 to $84.11, with high probability of sideways to higher price action absent a breakdown below $81.53.
Overbought risk emerges as intraday strength meets momentum loss
IBKR is trading above the SMA-20 ($83.07), SMA-50 ($76.03), and SMA-200 ($69.99). The Ichimoku Kijun at $81.53 provides immediate support. MACD and ADX reflect bullish momentum, while RSI remains neutral at 49.63, and Stoch RSI shows oversold conditions, suggesting short-term exhaustion. BBP is overbought at 1.10, indicating strong buyer dominance intraday, while the Awesome Oscillator is neutral. A small gap up at today’s open ($81.35 to $82.50) and trading near session highs signal ongoing intraday strength, although diverging momentum and oscillators highlight a possible risk of near-term consolidation.
Consolidation likely as volatility narrows and upside risk persists
In the coming five days, IBKR is likely to remain within the $81.69 to $84.11 range, reflecting typical volatility for the period. There is a very high probability—over 80%—of additional price gains, while a decline is less likely. The core scenario envisions price action consolidating sideways around current levels. If buyer momentum persists, a breakout above $84.11 may occur; a loss of immediate support at $81.53 could trigger a retreat toward the weekly low.
Earlier, analysts noted that Interactive Brokers maintained a bullish technical structure despite short-term volatility and mixed momentum signals. The current setup reinforces this outlook, with broad strength above major moving averages and the potential for a decisive move if momentum persists, making a breakout above $84.11 a critical level to watch in the days ahead.


Latest Interactive Brokers News


-
 Afghanistan
-
 Albania
-
 Algeria
-
 Angola
-
 Argentina
-
 Armenia
-
 Australia
-
 Austria
-
 Azerbaijan
-
 Bahamas
-
 Bahrain
-
 Bangladesh
-
 Belarus
-
 Belgium
-
 Bolivia
-
 Botswana
-
 Brazil
-
 Brunei
-
 Bulgaria
-
 Cambodia
-
 Cameroon
-
 Canada
-
 Chile
Chile
-
 China
China
-
 Colombia
-
 Congo
Congo
-
 Costa Rica
-
 Cote d'Ivoire
-
 Croatia
-
 Cuba
Cuba
-
 Cyprus
-
 Czechia
-
 DR Congo
-
 Denmark
-
 Dominican Republic
-
 Ecuador
-
 Egypt
Egypt
-
 El Salvador
-
 Estonia
-
 Eswatini
-
 Ethiopia
-
 Finland
-
 France
-
 Georgia
-
 Germany
-
 Ghana
Ghana
-
 Greece
-
 Haiti
Haiti
-
 Hong Kong
-
 Hungary
-
 India
India
-
 Indonesia
-
 Iran, Islamic republic
-
 Iraq
Iraq
-
 Ireland
-
 Israel
-
 Italy
Italy
-
 Jamaica
-
 Japan
Japan
-
 Jordan
-
 Kazakhstan
-
 Kenya
Kenya
-
 Korea
Korea
-
 Kuwait
-
 Kyrgyzstan
-
 Laos
Laos
-
 Latvia
-
 Lebanon
-
 Lesotho
-
 Libya
Libya
-
 Lithuania
-
 Luxembourg
-
 Madagascar
-
 Malaysia
-
 Malta
Malta
-
 Mauritius
-
 Mexico
-
 Moldova
-
 Mongolia
-
 Montenegro
-
 Morocco
-
 Mozambique
-
 Myanmar
-
 Namibia
-
 Nepal
Nepal
-
 Netherlands
-
 New Zealand
-
 Nigeria
-
 North Macedonia
-
 Norway
-
 Oman
Oman
-
 Pakistan
-
 Palestine
-
 Panama
-
 Papua New Guinea
-
 Paraguay
-
 Peru
Peru
-
 Philippines
-
 Poland
-
 Portugal
-
 Puerto Rico
-
 Qatar
Qatar
-
 Reunion
-
 Romania
-
 Rwanda
-
 Saudi Arabia
-
 Serbia
-
 Singapore
-
 Slovakia
-
 Slovenia
-
 Somalia
-
 South Africa
-
 Spain
Spain
-
 Sri Lanka
-
 Sweden
-
 Switzerland
-
 Syria
Syria
-
 Taiwan
-
 Tajikistan
-
 Tanzania
-
 Thailand
-
 Trinidad and Tobago
-
 Tunisia
-
 Turkey
-
 UAE
UAE
-
 Uganda
-
 Ukraine
-
 United Kingdom
-
United States
-
 Uruguay
-
 Uzbekistan
-
 Venezuela
-
 Vietnam
-
 Yemen
Yemen
-
 Zambia
-
 Zimbabwe
- Forex
- Crypto
