
PepsiCo stock edges down as oversold indicators dominate technical picture: weekly forecast

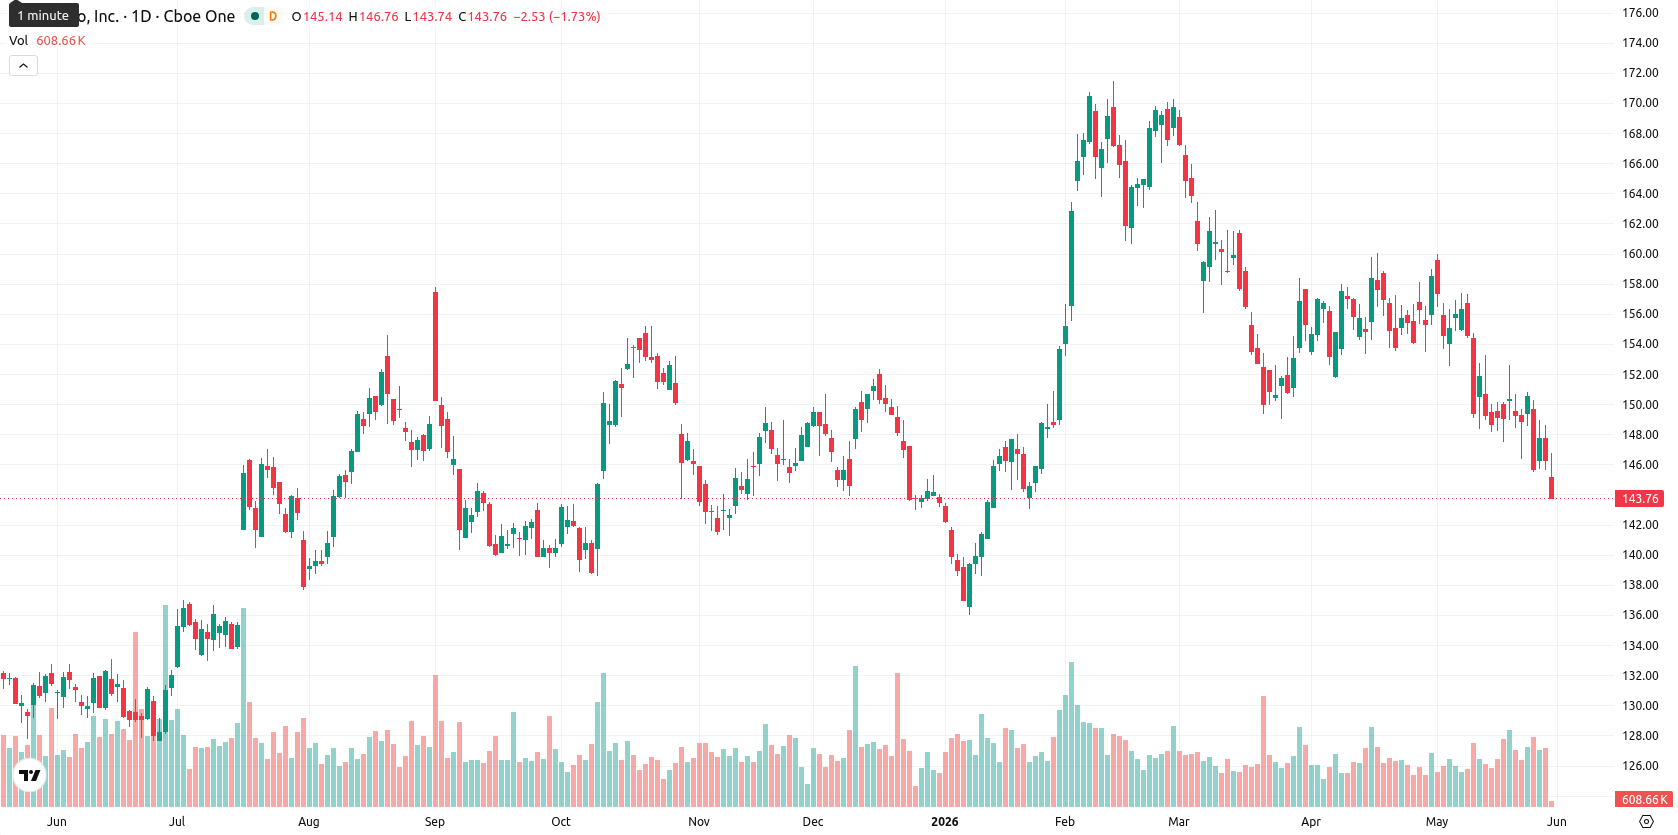
PepsiCo, Inc. (PEP) is now trading at $145.83, having declined $4.76 (3.16%) over the past week. The asset remains below the weekly MA-20 ($156.16), MA-50 ($148.85), and MA-200 ($163.68), highlighting sustained downward pressure and positioning PEP at the lower end of its weekly range.
Highlights
- PepsiCo trades below major moving averages, confirming sustained downward momentum and dominant seller pressure in both medium and long-term outlooks.
- Momentum and oscillators indicate weak buying conviction, with multiple oversold signals yet no emergence of bullish momentum.
- Forecasted price range for the next week is $142.70 to $149.00, with a higher probability of continued consolidation or further declines unless buyers regain control.
Dividend hike and upbeat guidance drive institutional inflows this week
PepsiCo raised its quarterly dividend by 4% to $1.48 per share, payable on June 30, 2026, with a record date of June 5, following stronger than expected Q1 2026 earnings. The company reaffirmed its full-year guidance for organic revenue and core EPS growth, supported by reduced salty snack prices in the US and steady demand for diet sodas. Institutional investors increased their holdings during the fourth quarter, and PepsiCo advanced its sustainability efforts through new agricultural collaborations in Europe and packaging updates in India.
Bearish bias persists as PEP closes week oversold and momentum stalls
On the weekly chart, PEP trades below all major moving averages (MA-20 at $156.16, MA-50 at $148.85, and MA-200 at $163.68), reinforcing a bearish bias with the MA-50 acting as near-term resistance. Major indicators remain subdued: MACD, ADX, and the Awesome Oscillator are neutral, while RSI, Stochastic RSI, Bull/Bear Power, and CCI point to oversold and seller-dominated conditions. Weekly volatility stands at 3.26%, and the price closed at the bottom of the weekly range, emphasizing the absence of bullish momentum.
Range-bound outlook favored as technicals signal low rebound risk next week
For the next 5 trading days, PEP is forecast to move within a range of $142.70 to $149.00, consistent with recent weekly volatility. The likelihood of a decisive move higher is very low, with sideways consolidation the most probable scenario, as key indicators show no shift toward buying. A break above $149.00 would signal renewed bullish momentum, while a close below $142.70 would confirm continued seller dominance and could prompt further declines.
Earlier, analysts noted that persistent selling pressure and mostly bearish technical signals kept a bearish tone for PepsiCo shares despite long-term growth initiatives. The latest results reinforce this cautious outlook, as PEP remains under key moving averages with muted momentum, making a break above $149.00 a pivotal signal for any short-term rebound.


-
 Afghanistan
-
 Albania
-
 Algeria
-
 Angola
-
 Argentina
-
 Armenia
-
 Australia
-
 Austria
-
 Azerbaijan
-
 Bahamas
-
 Bahrain
-
 Bangladesh
-
 Belarus
-
 Belgium
-
 Bolivia
-
 Botswana
-
 Brazil
-
 Brunei
-
 Bulgaria
-
 Cambodia
-
 Cameroon
-
 Canada
-
 Chile
Chile
-
 China
China
-
 Colombia
-
 Congo
Congo
-
 Costa Rica
-
 Cote d'Ivoire
-
 Croatia
-
 Cuba
Cuba
-
 Cyprus
-
 Czechia
-
 DR Congo
-
 Denmark
-
 Dominican Republic
-
 Ecuador
-
 Egypt
Egypt
-
 El Salvador
-
 Estonia
-
 Eswatini
-
 Ethiopia
-
 Finland
-
 France
-
 Georgia
-
 Germany
-
 Ghana
Ghana
-
 Greece
-
 Haiti
Haiti
-
 Hong Kong
-
 Hungary
-
 India
India
-
 Indonesia
-
 Iran, Islamic republic
-
 Iraq
Iraq
-
 Ireland
-
 Israel
-
 Italy
Italy
-
 Jamaica
-
 Japan
Japan
-
 Jordan
-
 Kazakhstan
-
 Kenya
Kenya
-
 Korea
Korea
-
 Kuwait
-
 Kyrgyzstan
-
 Laos
Laos
-
 Latvia
-
 Lebanon
-
 Lesotho
-
 Libya
Libya
-
 Lithuania
-
 Luxembourg
-
 Madagascar
-
 Malaysia
-
 Malta
Malta
-
 Mauritius
-
 Mexico
-
 Moldova
-
 Mongolia
-
 Montenegro
-
 Morocco
-
 Mozambique
-
 Myanmar
-
 Namibia
-
 Nepal
Nepal
-
 Netherlands
-
 New Zealand
-
 Nigeria
-
 North Macedonia
-
 Norway
-
 Oman
Oman
-
 Pakistan
-
 Palestine
-
 Panama
-
 Papua New Guinea
-
 Paraguay
-
 Peru
Peru
-
 Philippines
-
 Poland
-
 Portugal
-
 Puerto Rico
-
 Qatar
Qatar
-
 Reunion
-
 Romania
-
 Rwanda
-
 Saudi Arabia
-
 Serbia
-
 Singapore
-
 Slovakia
-
 Slovenia
-
 Somalia
-
 South Africa
-
 Spain
Spain
-
 Sri Lanka
-
 Sweden
-
 Switzerland
-
 Syria
Syria
-
 Taiwan
-
 Tajikistan
-
 Tanzania
-
 Thailand
-
 Trinidad and Tobago
-
 Tunisia
-
 Turkey
-
 UAE
UAE
-
 Uganda
-
 Ukraine
-
 United Kingdom
-
United States
-
 Uruguay
-
 Uzbekistan
-
 Venezuela
-
 Vietnam
-
 Yemen
Yemen
-
 Zambia
-
 Zimbabwe
- Forex
- Crypto
