
American Airlines stock declines as uptrend loses pace after recent overbought levels

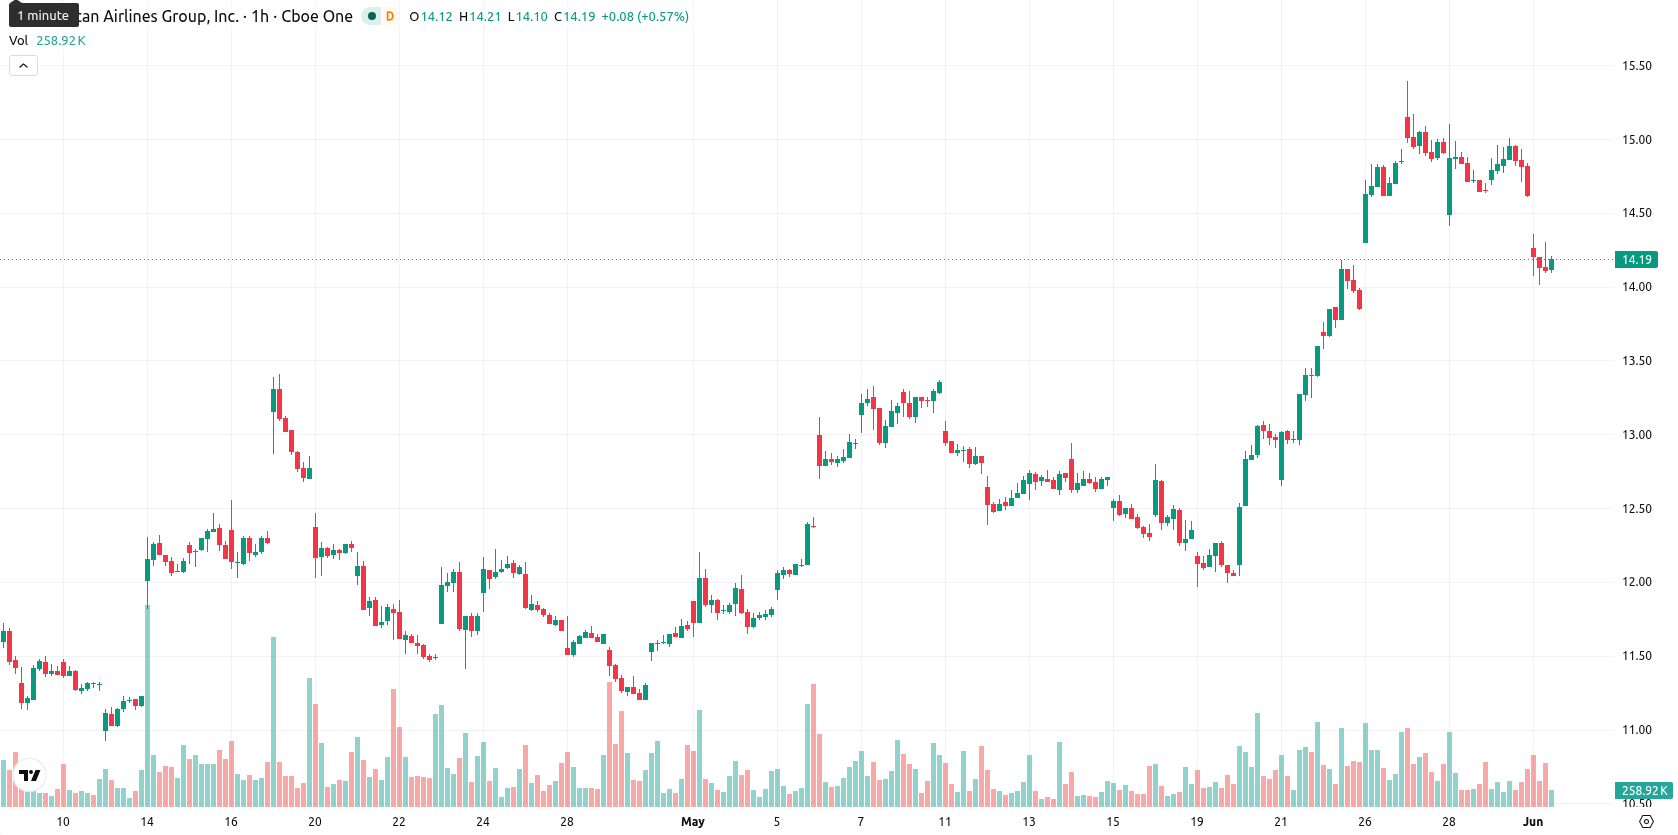
American Airlines Group (AAL) stock is trading at $14.18, down 3.14% on the day. The price remains well above its key moving averages, signaling a divergence between short-term selling and longer-term bullish momentum.
Highlights
- Price action remains decisively bullish across short-, medium-, and long-term frames, supported by positive trend signals despite today's 3.14% pullback.
- Short-term technical indicators signal overbought conditions and weakening trend strength, suggesting the probability of a pause or near-term pullback.
- Expected five-day trading range stands at $14.00–$15.30, with over 80% probability favoring price stability or further upside unless support at $14.00 fails.
Overbought readings and weak trend signal retracement risk
The $14.18 level is notably above the SMA-20 ($13.13), SMA-50 ($12.04), and SMA-200 ($13.05), with the Ichimoku Kijun at $13.29 serving as the immediate support. Technical readings indicate positive MACD on the daily chart, but ADX reflects weak trend strength. RSI and CCI are both near or in overbought territory, and Stoch RSI also suggests overbought conditions, while BBP at 1.29 points to intraday buyer dominance. The Awesome Oscillator remains supportive of the prevailing uptrend. Today's action has brought the price near the session's low within a $14.01–$14.35 range, highlighting renewed intraday selling pressure despite the broader positive momentum. Oscillator divergences and overbought signals raise caution for a possible short-term pause or pullback.
Upside favored if support holds amid heightened volatility
Over the next five trading days, AAL is expected to trade within the $14.00 to $15.30 range, consistent with typical volatility for the current regime. The probability of a price increase stands above 80%, favoring further upside stabilization. Bullish scenario triggers would include a decisive close above $15.30, opening the door to a potential move toward previous highs. Failure to maintain the $14.00 support zone may lead to a corrective pullback, though strong longer-term support levels remain intact.
In a recent review, American Airlines was characterized by mixed technical momentum, with overbought signals and heightened volatility prompting a cautious outlook. The current action strengthens this view, as persistent overbought conditions and ongoing intraday selling suggest that traders should closely monitor for a short-term pause before considering new positions.


Latest American Airlines News


-
 Afghanistan
-
 Albania
-
 Algeria
-
 Angola
-
 Argentina
-
 Armenia
-
 Australia
-
 Austria
-
 Azerbaijan
-
 Bahamas
-
 Bahrain
-
 Bangladesh
-
 Belarus
-
 Belgium
-
 Bolivia
-
 Botswana
-
 Brazil
-
 Brunei
-
 Bulgaria
-
 Cambodia
-
 Cameroon
-
 Canada
-
 Chile
Chile
-
 China
China
-
 Colombia
-
 Congo
Congo
-
 Costa Rica
-
 Cote d'Ivoire
-
 Croatia
-
 Cuba
Cuba
-
 Cyprus
-
 Czechia
-
 DR Congo
-
 Denmark
-
 Dominican Republic
-
 Ecuador
-
 Egypt
Egypt
-
 El Salvador
-
 Estonia
-
 Eswatini
-
 Ethiopia
-
 Finland
-
 France
-
 Georgia
-
 Germany
-
 Ghana
Ghana
-
 Greece
-
 Haiti
Haiti
-
 Hong Kong
-
 Hungary
-
 India
India
-
 Indonesia
-
 Iran, Islamic republic
-
 Iraq
Iraq
-
 Ireland
-
 Israel
-
 Italy
Italy
-
 Jamaica
-
 Japan
Japan
-
 Jordan
-
 Kazakhstan
-
 Kenya
Kenya
-
 Korea
Korea
-
 Kuwait
-
 Kyrgyzstan
-
 Laos
Laos
-
 Latvia
-
 Lebanon
-
 Lesotho
-
 Libya
Libya
-
 Lithuania
-
 Luxembourg
-
 Madagascar
-
 Malaysia
-
 Malta
Malta
-
 Mauritius
-
 Mexico
-
 Moldova
-
 Mongolia
-
 Montenegro
-
 Morocco
-
 Mozambique
-
 Myanmar
-
 Namibia
-
 Nepal
Nepal
-
 Netherlands
-
 New Zealand
-
 Nigeria
-
 North Macedonia
-
 Norway
-
 Oman
Oman
-
 Pakistan
-
 Palestine
-
 Panama
-
 Papua New Guinea
-
 Paraguay
-
 Peru
Peru
-
 Philippines
-
 Poland
-
 Portugal
-
 Puerto Rico
-
 Qatar
Qatar
-
 Reunion
-
 Romania
-
 Rwanda
-
 Saudi Arabia
-
 Serbia
-
 Singapore
-
 Slovakia
-
 Slovenia
-
 Somalia
-
 South Africa
-
 Spain
Spain
-
 Sri Lanka
-
 Sweden
-
 Switzerland
-
 Syria
Syria
-
 Taiwan
-
 Tajikistan
-
 Tanzania
-
 Thailand
-
 Trinidad and Tobago
-
 Tunisia
-
 Turkey
-
 UAE
UAE
-
 Uganda
-
 Ukraine
-
 United Kingdom
-
United States
-
 Uruguay
-
 Uzbekistan
-
 Venezuela
-
 Vietnam
-
 Yemen
Yemen
-
 Zambia
-
 Zimbabwe
- Forex
- Crypto
