
AMZN stock edges higher as price holds above key moving averages: weekly outlook

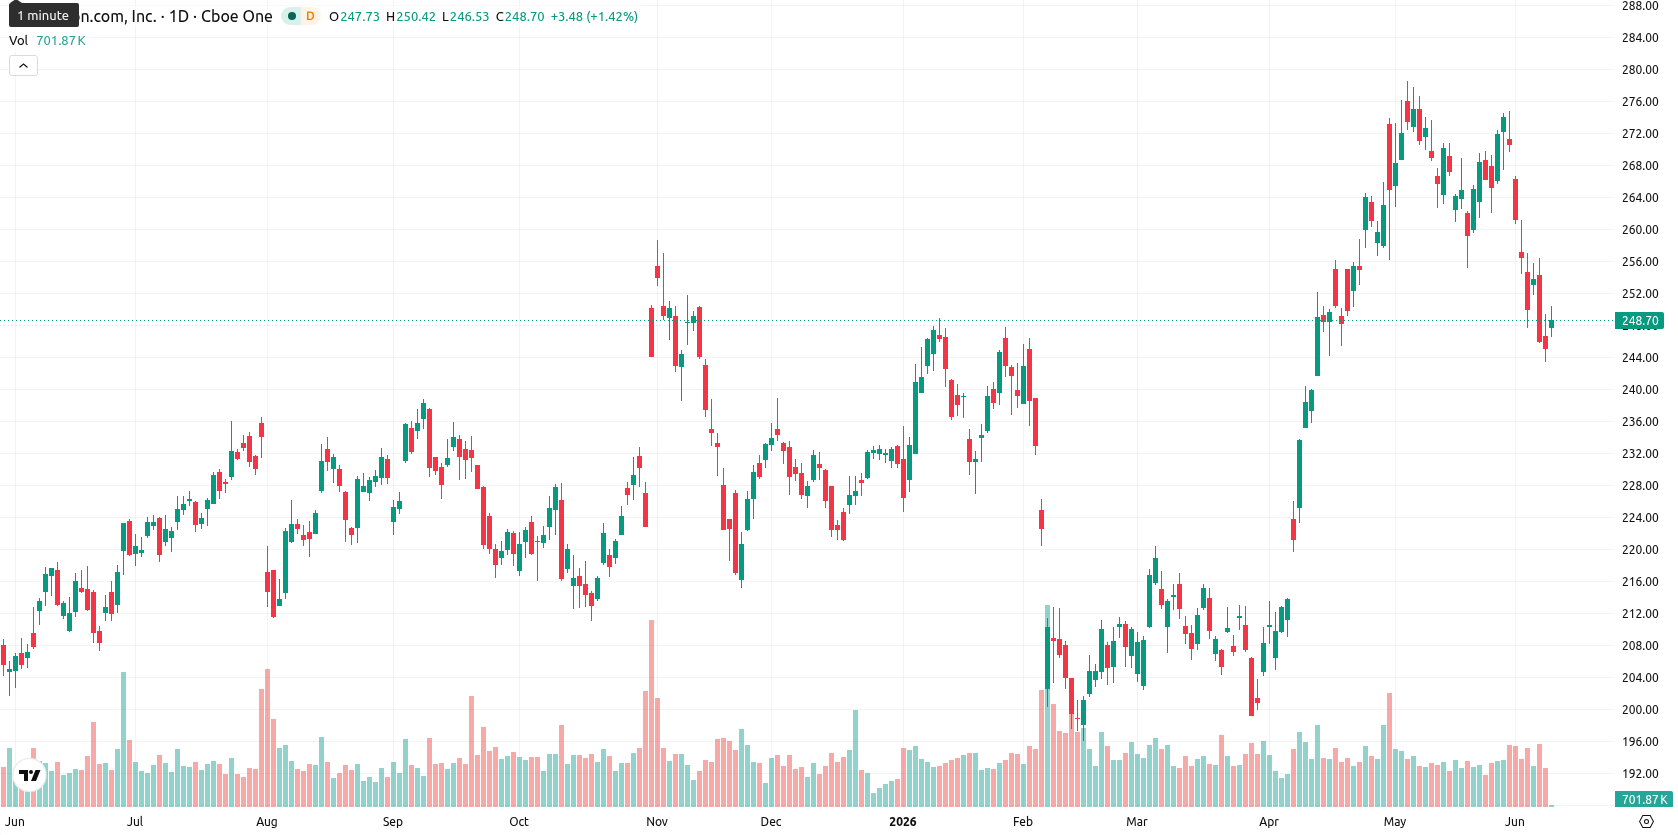
Amazon.com, Inc. (AMZN) is currently trading at $249.01, having gained $2.99 (1.22%) over the last week. The price remains well above the weekly MA-20 at $234.38, MA-50 at $230.98, and MA-200 at $175.19, confirming a solid bullish structure and suggesting dynamic support near its shorter-term moving averages.
Highlights
- Amazon maintains a bullish technical structure, trading above key moving averages and recovering moderately from recent lows.
- Momentum indicators are mixed, with MACD and RSI showing upward bias, but trend strength and oscillators signaling neutral conditions.
- For the next week, price is expected to consolidate between $236.00 and $261.00, with a balanced probability of either breakout or reversal.
Logistics investment and robust Q1 growth bolster weekly sentiment
Amazon announced a more than €10 billion investment to modernize and expand its European fulfillment centers with advanced robotics, underlining the company's ongoing focus on logistics efficiency. The tech giant also secured a multi-billion dollar, multi-year agreement with Corning to supply fiber optics and connectivity solutions, supporting its data center growth and creating 1,000 new jobs in North Carolina. Amazon’s advertising segment surpassed a $70 billion annual run rate, and AWS reported Q1 sales growth of 28% to $37.6 billion, further highlighting Amazon's strong diversification.
Bullish structure sustained as technicals show mixed momentum signals
Weekly technical analysis shows AMZN trading securely above all major weekly moving averages, with dynamic support around $234.38 (MA-20) and $230.98 (MA-50). Support for the week is expected near $236.00, while resistance is seen at $261.00. The RSI on the weekly timeframe is in the Buy zone, indicating moderate bullish momentum, but other signals including the Stochastic RSI and CCI are neutral, and the ADX suggests weak trend strength. Momentum divergence is apparent, with the MACD bullish but Bull/Bear Power indicating a recent oversold condition and the Awesome Oscillator staying neutral.
Range-bound outlook as consolidation risk tempers breakout potential
For the next 5 trading days, AMZN is likely to consolidate in the $236.00 – $261.00 range, with a roughly 50/50 probability of either upside or downside movement based on current indicators. The baseline scenario is for range-bound action near present levels, barring a clear shift in directional momentum. A break above $261.00 could trigger further gains, but upside may be limited without broader confirmation from momentum indicators. If the price falls below $236.00, the next area of focus would be support at the MA-20.
Previously it was reported that Amazon's multi-billion dollar supply agreement with Corning marked a significant step in expanding its AI-focused data center infrastructure and bolstering supply chain resilience. Building on this foundation, the current technical environment suggests traders should monitor a sustained move above $261.00 as a potential catalyst for the next leg higher, especially if momentum indicators start to confirm renewed strength.


-
 Afghanistan
-
 Albania
-
 Algeria
-
 Angola
-
 Argentina
-
 Armenia
-
 Australia
-
 Austria
-
 Azerbaijan
-
 Bahamas
-
 Bahrain
-
 Bangladesh
-
 Belarus
-
 Belgium
-
 Bolivia
-
 Botswana
-
 Brazil
-
 Brunei
-
 Bulgaria
-
 Cambodia
-
 Cameroon
-
 Canada
-
 Chile
Chile
-
 China
China
-
 Colombia
-
 Congo
Congo
-
 Costa Rica
-
 Cote d'Ivoire
-
 Croatia
-
 Cuba
Cuba
-
 Cyprus
-
 Czechia
-
 DR Congo
-
 Denmark
-
 Dominican Republic
-
 Ecuador
-
 Egypt
Egypt
-
 El Salvador
-
 Estonia
-
 Eswatini
-
 Ethiopia
-
 Finland
-
 France
-
 Georgia
-
 Germany
-
 Ghana
Ghana
-
 Greece
-
 Haiti
Haiti
-
 Hong Kong
-
 Hungary
-
 India
India
-
 Indonesia
-
 Iran, Islamic republic
-
 Iraq
Iraq
-
 Ireland
-
 Israel
-
 Italy
Italy
-
 Jamaica
-
 Japan
Japan
-
 Jordan
-
 Kazakhstan
-
 Kenya
Kenya
-
 Korea
Korea
-
 Kuwait
-
 Kyrgyzstan
-
 Laos
Laos
-
 Latvia
-
 Lebanon
-
 Lesotho
-
 Libya
Libya
-
 Lithuania
-
 Luxembourg
-
 Madagascar
-
 Malaysia
-
 Malta
Malta
-
 Mauritius
-
 Mexico
-
 Moldova
-
 Mongolia
-
 Montenegro
-
 Morocco
-
 Mozambique
-
 Myanmar
-
 Namibia
-
 Nepal
Nepal
-
 Netherlands
-
 New Zealand
-
 Nigeria
-
 North Macedonia
-
 Norway
-
 Oman
Oman
-
 Pakistan
-
 Palestine
-
 Panama
-
 Papua New Guinea
-
 Paraguay
-
 Peru
Peru
-
 Philippines
-
 Poland
-
 Portugal
-
 Puerto Rico
-
 Qatar
Qatar
-
 Reunion
-
 Romania
-
 Rwanda
-
 Saudi Arabia
-
 Serbia
-
 Singapore
-
 Slovakia
-
 Slovenia
-
 Somalia
-
 South Africa
-
 Spain
Spain
-
 Sri Lanka
-
 Sweden
-
 Switzerland
-
 Syria
Syria
-
 Taiwan
-
 Tajikistan
-
 Tanzania
-
 Thailand
-
 Trinidad and Tobago
-
 Tunisia
-
 Turkey
-
 UAE
UAE
-
 Uganda
-
 Ukraine
-
 United Kingdom
-
United States
-
 Uruguay
-
 Uzbekistan
-
 Venezuela
-
 Vietnam
-
 Yemen
Yemen
-
 Zambia
-
 Zimbabwe
- Forex
- Crypto
