
User data privacy settlement drives Meta stock higher

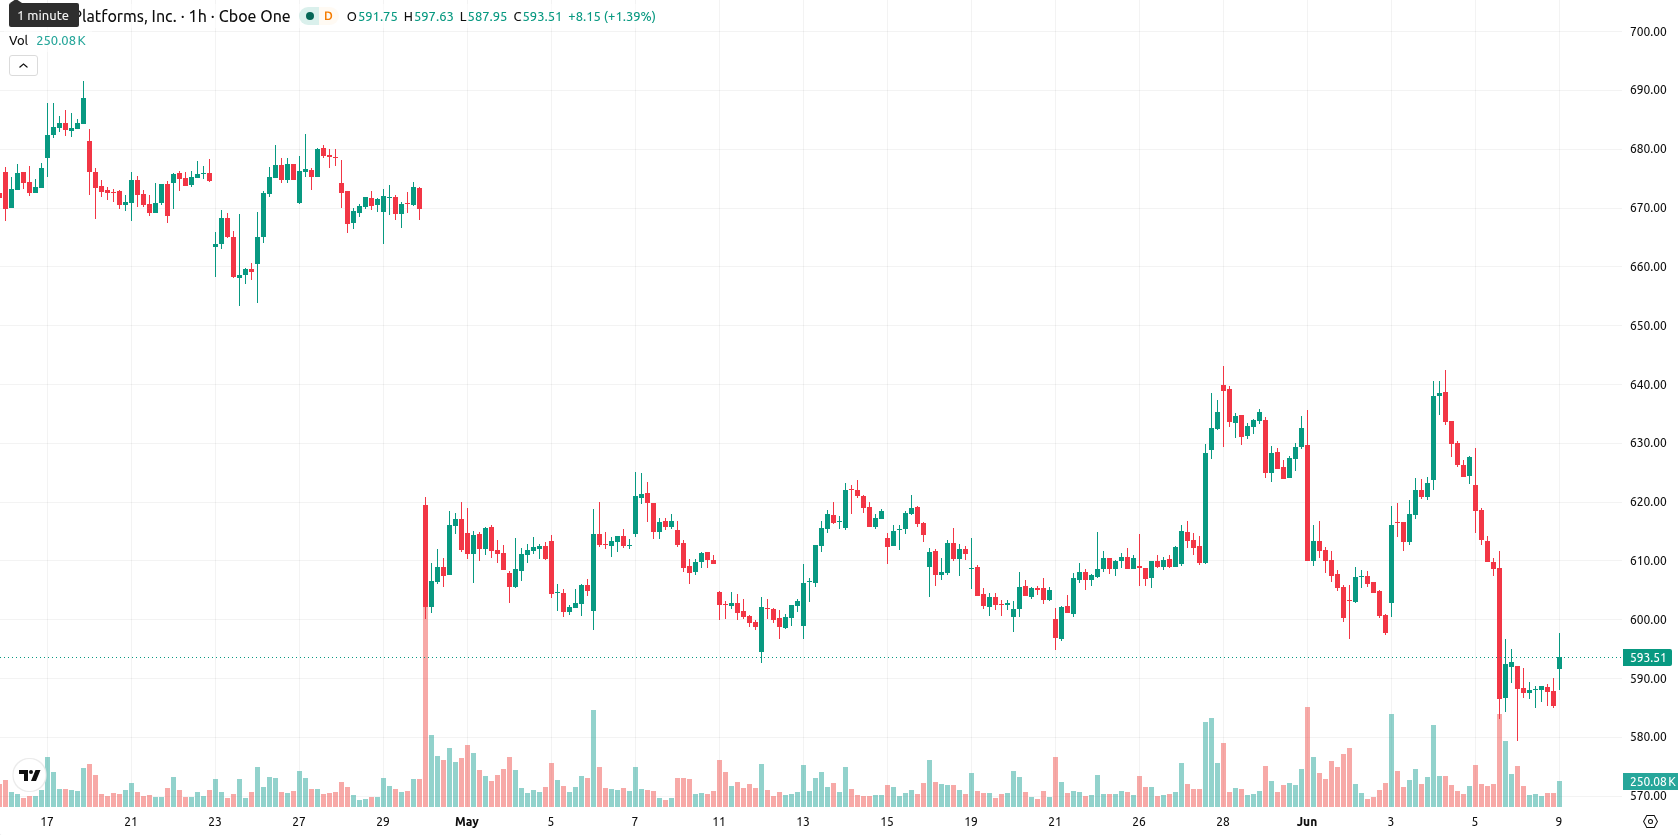
Meta Platforms (META) stock is trading at $596.94, up 1.97% on the day and finishing near the session high. The price remains below its key moving averages, reflecting ongoing short-term pressure despite the intraday rebound.
Highlights
- Meta will allocate $125 billion to $145 billion for AI infrastructure by 2026, reprioritizing capital spending over share buybacks.
- Q1 2026 results showed strong operational momentum, with revenue of $56.31 billion and earnings per share of $10.44.
- META/USD trades below key moving averages and remains under broad bearish momentum, with a projected range of $570.56 to $623.32 and 65% odds of further downside.
Capital commitments rise and buybacks paused as spending shifts to AI
Meta's decision to more than double its 2026 capital expenditure guidance, outlining plans to spend between $125 billion and $145 billion on artificial intelligence infrastructure, highlights a strategic commitment to large-scale technological investment and reshapes internal funding priorities. At the same time, the pause of the company's share buyback program, confirmed by CFO Susan Li, shifts capital allocation away from equity repurchases and may moderate some direct market demand for shares. Meanwhile, Meta reported Q1 2026 revenue of $56.31 billion and earnings per share of $10.44, underscoring underlying operational momentum. Additionally, distributions from the $725 million US user data privacy settlement are set to begin on June 9, marking a resolution of a major regulatory overhang.
Sustained downside bias as sellers dominate below technical thresholds
On the technical front, META is trading below the MA-20 ($603.06), MA-50 ($610.91), and MA-200 ($661.62) on the H1 chart, with the Ichimoku Kijun at $610.78 acting as immediate resistance. Momentum indicators—including a sell bias in both MACD and ADX, RSI at 30.61, and CCI readings—confirm continued selling signals. Stoch RSI and BBP show oversold conditions, with sellers dominating, while the Awesome Oscillator is neutral and offers no directional confirmation. Short-term rebound attempts remain unconfirmed by trend metrics, and oscillator divergence signals caution for buyers.
Further losses likely unless resistance breach reverses trend
Over the next two to three trading days, the anticipated volatility band is between $570.56 and $623.32. Odds favor further downside, with a 65% probability of continued weakness and a 35% chance of an upward move. Price is expected to consolidate within this range unless a break above $610.78 signals a bullish scenario or a drop below $570.56 opens the door to further declines.
Previously it was reported that Meta launched a major workforce training initiative to support its expanding AI data center infrastructure and broader investment in U.S. jobs. The company's current shift in capital allocation, alongside heightened spending on AI infrastructure and the temporary suspension of share buybacks, underscores a strategic pivot where sustained volatility around the $570.56–$623.32 range and the potential reaction to a break of these levels should be actively monitored.


-
 Afghanistan
-
 Albania
-
 Algeria
-
 Angola
-
 Argentina
-
 Armenia
-
 Australia
-
 Austria
-
 Azerbaijan
-
 Bahamas
-
 Bahrain
-
 Bangladesh
-
 Belarus
-
 Belgium
-
 Bolivia
-
 Botswana
-
 Brazil
-
 Brunei
-
 Bulgaria
-
 Cambodia
-
 Cameroon
-
 Canada
-
 Chile
Chile
-
 China
China
-
 Colombia
-
 Congo
Congo
-
 Costa Rica
-
 Cote d'Ivoire
-
 Croatia
-
 Cuba
Cuba
-
 Cyprus
-
 Czechia
-
 DR Congo
-
 Denmark
-
 Dominican Republic
-
 Ecuador
-
 Egypt
Egypt
-
 El Salvador
-
 Estonia
-
 Eswatini
-
 Ethiopia
-
 Finland
-
 France
-
 Georgia
-
 Germany
-
 Ghana
Ghana
-
 Greece
-
 Haiti
Haiti
-
 Hong Kong
-
 Hungary
-
 India
India
-
 Indonesia
-
 Iran, Islamic republic
-
 Iraq
Iraq
-
 Ireland
-
 Israel
-
 Italy
Italy
-
 Jamaica
-
 Japan
Japan
-
 Jordan
-
 Kazakhstan
-
 Kenya
Kenya
-
 Korea
Korea
-
 Kuwait
-
 Kyrgyzstan
-
 Laos
Laos
-
 Latvia
-
 Lebanon
-
 Lesotho
-
 Libya
Libya
-
 Lithuania
-
 Luxembourg
-
 Madagascar
-
 Malaysia
-
 Malta
Malta
-
 Mauritius
-
 Mexico
-
 Moldova
-
 Mongolia
-
 Montenegro
-
 Morocco
-
 Mozambique
-
 Myanmar
-
 Namibia
-
 Nepal
Nepal
-
 Netherlands
-
 New Zealand
-
 Nigeria
-
 North Macedonia
-
 Norway
-
 Oman
Oman
-
 Pakistan
-
 Palestine
-
 Panama
-
 Papua New Guinea
-
 Paraguay
-
 Peru
Peru
-
 Philippines
-
 Poland
-
 Portugal
-
 Puerto Rico
-
 Qatar
Qatar
-
 Reunion
-
 Romania
-
 Rwanda
-
 Saudi Arabia
-
 Serbia
-
 Singapore
-
 Slovakia
-
 Slovenia
-
 Somalia
-
 South Africa
-
 Spain
Spain
-
 Sri Lanka
-
 Sweden
-
 Switzerland
-
 Syria
Syria
-
 Taiwan
-
 Tajikistan
-
 Tanzania
-
 Thailand
-
 Trinidad and Tobago
-
 Tunisia
-
 Turkey
-
 UAE
UAE
-
 Uganda
-
 Ukraine
-
 United Kingdom
-
United States
-
 Uruguay
-
 Uzbekistan
-
 Venezuela
-
 Vietnam
-
 Yemen
Yemen
-
 Zambia
-
 Zimbabwe
- Forex
- Crypto
