
Marathon Digital stock trades lower as price holds below crucial moving averages

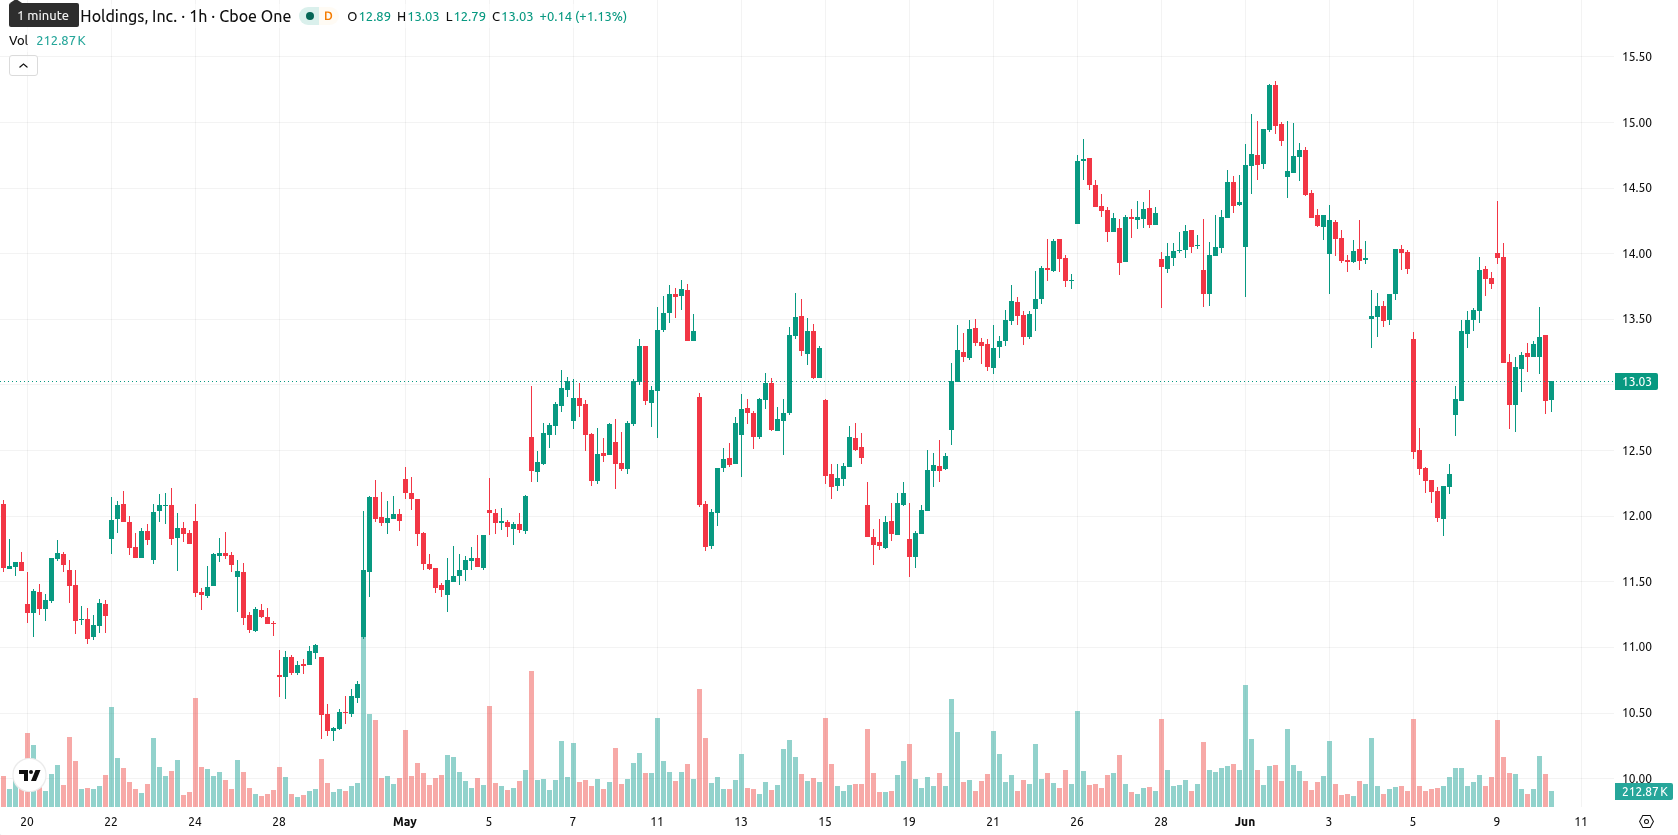
Marathon Digital Holdings, Inc. (MARA) stock is trading at $12.90, down 3.08% for the day. The price is currently positioned below its key short- and medium-term moving averages while remaining above the long-term average.
Highlights
- MARA/USD faces short- and medium-term selling pressure but maintains long-term support, indicating overall bearish bias.
- Momentum indicators mostly confirm weakness while oscillators show no strong overbought or oversold conditions, suggesting limited directional conviction.
- Price is likely to trade sideways between $11.76 and $14.04, with a higher probability of a downward move unless resistance at $13.13 is broken.
Divergent momentum and oscillator signals amid sustained sell pressure
On the technical side, MARA/USD is trading below the MA-20 ($13.16) and MA-50 ($13.71) on the hourly chart but holds above the MA-200 ($12.61) on the daily timeframe. Immediate resistance is present at the Ichimoku Kijun level of $13.13. The MACD is showing a strong sell signal, while the ADX is neutral, reflecting a lack of clear momentum despite noticeable downward action. RSI stands at 49.59 with a sell bias; Stochastic RSI and CCI are neutral, suggesting neither overbought nor oversold conditions. BBP indicates intraday buyer dominance, which contrasts with the broader negative sentiment, and the Awesome Oscillator remains neutral. Divergence between momentum and oscillators points to some intraday resilience from buyers, even as major momentum gauges confirm continuing weakness.
Sideways movement likely as bearish risks outweigh bullish scenario
For the next few sessions, the expected volatility band for MARA/USD is between $11.76 and $14.04. There is a 42% probability of an upward move, while a downward scenario remains more likely at this stage. The baseline scenario anticipates that MARA/USD will move sideways within this corridor. A bullish breakout would require a move above resistance at the Kijun level, while a bearish scenario could develop if support around the lower boundary fails.
Earlier, analysts noted that Marathon Digital was exhibiting persistent buyer dominance despite mixed technical signals, with the uptrend seen as dependent on holding key support levels. The current shifts in momentum and the breakdown under short-term averages suggest traders should closely monitor the $11.76 support zone, as a sustained move below this level could trigger a deeper downside scenario.


-
 Afghanistan
-
 Albania
-
 Algeria
-
 Angola
-
 Argentina
-
 Armenia
-
 Australia
-
 Austria
-
 Azerbaijan
-
 Bahamas
-
 Bahrain
-
 Bangladesh
-
 Belarus
-
 Belgium
-
 Bolivia
-
 Botswana
-
 Brazil
-
 Brunei
-
 Bulgaria
-
 Cambodia
-
 Cameroon
-
 Canada
-
 Chile
Chile
-
 China
China
-
 Colombia
-
 Congo
Congo
-
 Costa Rica
-
 Cote d'Ivoire
-
 Croatia
-
 Cuba
Cuba
-
 Cyprus
-
 Czechia
-
 DR Congo
-
 Denmark
-
 Dominican Republic
-
 Ecuador
-
 Egypt
Egypt
-
 El Salvador
-
 Estonia
-
 Eswatini
-
 Ethiopia
-
 Finland
-
 France
-
 Georgia
-
 Germany
-
 Ghana
Ghana
-
 Greece
-
 Haiti
Haiti
-
 Hong Kong
-
 Hungary
-
 India
India
-
 Indonesia
-
 Iran, Islamic republic
-
 Iraq
Iraq
-
 Ireland
-
 Israel
-
 Italy
Italy
-
 Jamaica
-
 Japan
Japan
-
 Jordan
-
 Kazakhstan
-
 Kenya
Kenya
-
 Korea
Korea
-
 Kuwait
-
 Kyrgyzstan
-
 Laos
Laos
-
 Latvia
-
 Lebanon
-
 Lesotho
-
 Libya
Libya
-
 Lithuania
-
 Luxembourg
-
 Madagascar
-
 Malaysia
-
 Malta
Malta
-
 Mauritius
-
 Mexico
-
 Moldova
-
 Mongolia
-
 Montenegro
-
 Morocco
-
 Mozambique
-
 Myanmar
-
 Namibia
-
 Nepal
Nepal
-
 Netherlands
-
 New Zealand
-
 Nigeria
-
 North Macedonia
-
 Norway
-
 Oman
Oman
-
 Pakistan
-
 Palestine
-
 Panama
-
 Papua New Guinea
-
 Paraguay
-
 Peru
Peru
-
 Philippines
-
 Poland
-
 Portugal
-
 Puerto Rico
-
 Qatar
Qatar
-
 Reunion
-
 Romania
-
 Rwanda
-
 Saudi Arabia
-
 Serbia
-
 Singapore
-
 Slovakia
-
 Slovenia
-
 Somalia
-
 South Africa
-
 Spain
Spain
-
 Sri Lanka
-
 Sweden
-
 Switzerland
-
 Syria
Syria
-
 Taiwan
-
 Tajikistan
-
 Tanzania
-
 Thailand
-
 Trinidad and Tobago
-
 Tunisia
-
 Turkey
-
 UAE
UAE
-
 Uganda
-
 Ukraine
-
 United Kingdom
-
United States
-
 Uruguay
-
 Uzbekistan
-
 Venezuela
-
 Vietnam
-
 Yemen
Yemen
-
 Zambia
-
 Zimbabwe
- Forex
- Crypto
