
American Airlines stock price forecast: $12.96 support in focus as AAL extends losses

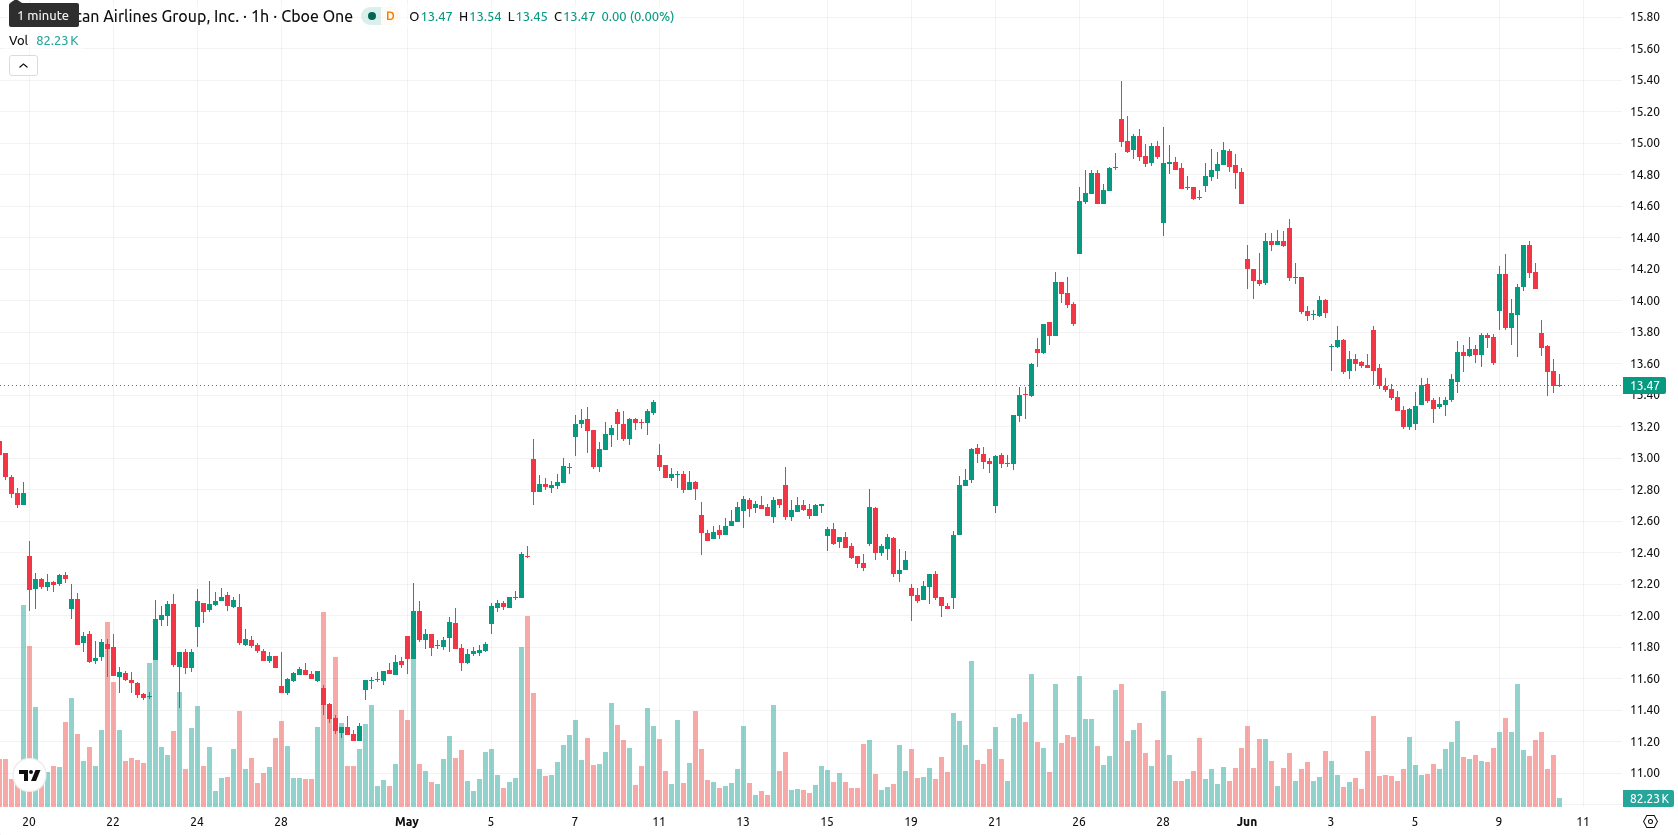
American Airlines Group Inc. (AAL) stock is trading at $13.50, down 4.19% for the session and near the day's lows. The price action sits below its key short- and medium-term moving averages, reflecting ongoing downside pressure in the short run.
Highlights
- American Airlines cut profit guidance due to elevated fuel costs and ongoing Middle East geopolitical disruptions, raising earnings uncertainty.
- The airline faced a net loss of $382 million and negative EPS of $0.58 despite generating strong free cash flow and reducing net long-term debt by $1.33 billion.
- Technical indicators show persistent short- and medium-term bearish pressure, with the price expected to range between $12.96 and $14.04 as volatility remains elevated.
Margin pressures intensify as profit reset meets higher costs and uncertainty
American Airlines announced a reset to its profit guidance, citing higher fuel costs and ongoing geopolitical disruptions in the Middle East, which has introduced added uncertainty around its forward earnings expectations. The company reported $13.9 billion in revenue for its latest quarter, while also recording a net loss of $382 million and negative EPS of $0.58; this outcome highlights the ongoing margin pressures affecting the business. Despite these headwinds, internal liquidity was supported by the generation of $4.22 billion in operating cash flow and $3.41 billion in free cash flow, alongside a $1.33 billion reduction in net long-term debt, though price action has remained under broader selling pressure.
Technical resistance weighs as mixed momentum signals spur session divergence
On the technical front, AAL is trading below the MA-20 ($13.76) and MA-50 ($13.75) on the hourly chart, while maintaining a position above the MA-200 ($13.08) on the daily timeframe. The Ichimoku Kijun at $13.78 is acting as immediate resistance, and support sits near $12.96. Among momentum indicators, MACD remains on a Strong Buy signal, while ADX shows Neutral trend strength; RSI prints a reading of 45.93 (Sell), CCI also points to Sell, and the Stoch RSI is in oversold territory. BBP indicates seller dominance in intraday movements, and the Awesome Oscillator is neutral, highlighting divergence between oscillators and an overall seller-driven session.
Bearish bias dominates short-term outlook amid prevailing volatility
Looking ahead, AAL is expected to trade within a volatility band of $12.96 to $14.04 for the next several sessions. The probability of further downside is estimated at 65%, with only a 35% chance of an upward move, making a near-term rebound less likely. The baseline scenario assumes range-bound movement as volatility persists; in a bullish scenario, a breakout above $13.78 could prompt recovery toward the upper band. If bearish pressure continues and the $12.96 support fails, further declines may unfold.
Earlier, analysts noted that American Airlines' technical outlook was bullish, supported by the removal of merger speculation and underlying momentum. However, the latest decline below key moving averages amid profit guidance resets and earnings pressure signals a potential shift toward sustained downside risk, making $12.96 an important support level to monitor for signs of further weakness.


Latest American Airlines News


-
 Afghanistan
-
 Albania
-
 Algeria
-
 Angola
-
 Argentina
-
 Armenia
-
 Australia
-
 Austria
-
 Azerbaijan
-
 Bahamas
-
 Bahrain
-
 Bangladesh
-
 Belarus
-
 Belgium
-
 Bolivia
-
 Botswana
-
 Brazil
-
 Brunei
-
 Bulgaria
-
 Cambodia
-
 Cameroon
-
 Canada
-
 Chile
Chile
-
 China
China
-
 Colombia
-
 Congo
Congo
-
 Costa Rica
-
 Cote d'Ivoire
-
 Croatia
-
 Cuba
Cuba
-
 Cyprus
-
 Czechia
-
 DR Congo
-
 Denmark
-
 Dominican Republic
-
 Ecuador
-
 Egypt
Egypt
-
 El Salvador
-
 Estonia
-
 Eswatini
-
 Ethiopia
-
 Finland
-
 France
-
 Georgia
-
 Germany
-
 Ghana
Ghana
-
 Greece
-
 Haiti
Haiti
-
 Hong Kong
-
 Hungary
-
 India
India
-
 Indonesia
-
 Iran, Islamic republic
-
 Iraq
Iraq
-
 Ireland
-
 Israel
-
 Italy
Italy
-
 Jamaica
-
 Japan
Japan
-
 Jordan
-
 Kazakhstan
-
 Kenya
Kenya
-
 Korea
Korea
-
 Kuwait
-
 Kyrgyzstan
-
 Laos
Laos
-
 Latvia
-
 Lebanon
-
 Lesotho
-
 Libya
Libya
-
 Lithuania
-
 Luxembourg
-
 Madagascar
-
 Malaysia
-
 Malta
Malta
-
 Mauritius
-
 Mexico
-
 Moldova
-
 Mongolia
-
 Montenegro
-
 Morocco
-
 Mozambique
-
 Myanmar
-
 Namibia
-
 Nepal
Nepal
-
 Netherlands
-
 New Zealand
-
 Nigeria
-
 North Macedonia
-
 Norway
-
 Oman
Oman
-
 Pakistan
-
 Palestine
-
 Panama
-
 Papua New Guinea
-
 Paraguay
-
 Peru
Peru
-
 Philippines
-
 Poland
-
 Portugal
-
 Puerto Rico
-
 Qatar
Qatar
-
 Reunion
-
 Romania
-
 Rwanda
-
 Saudi Arabia
-
 Serbia
-
 Singapore
-
 Slovakia
-
 Slovenia
-
 Somalia
-
 South Africa
-
 Spain
Spain
-
 Sri Lanka
-
 Sweden
-
 Switzerland
-
 Syria
Syria
-
 Taiwan
-
 Tajikistan
-
 Tanzania
-
 Thailand
-
 Trinidad and Tobago
-
 Tunisia
-
 Turkey
-
 UAE
UAE
-
 Uganda
-
 Ukraine
-
 United Kingdom
-
United States
-
 Uruguay
-
 Uzbekistan
-
 Venezuela
-
 Vietnam
-
 Yemen
Yemen
-
 Zambia
-
 Zimbabwe
- Forex
- Crypto
