
T-Mobile stock rises with Hyderabad tech expansion supporting US product development

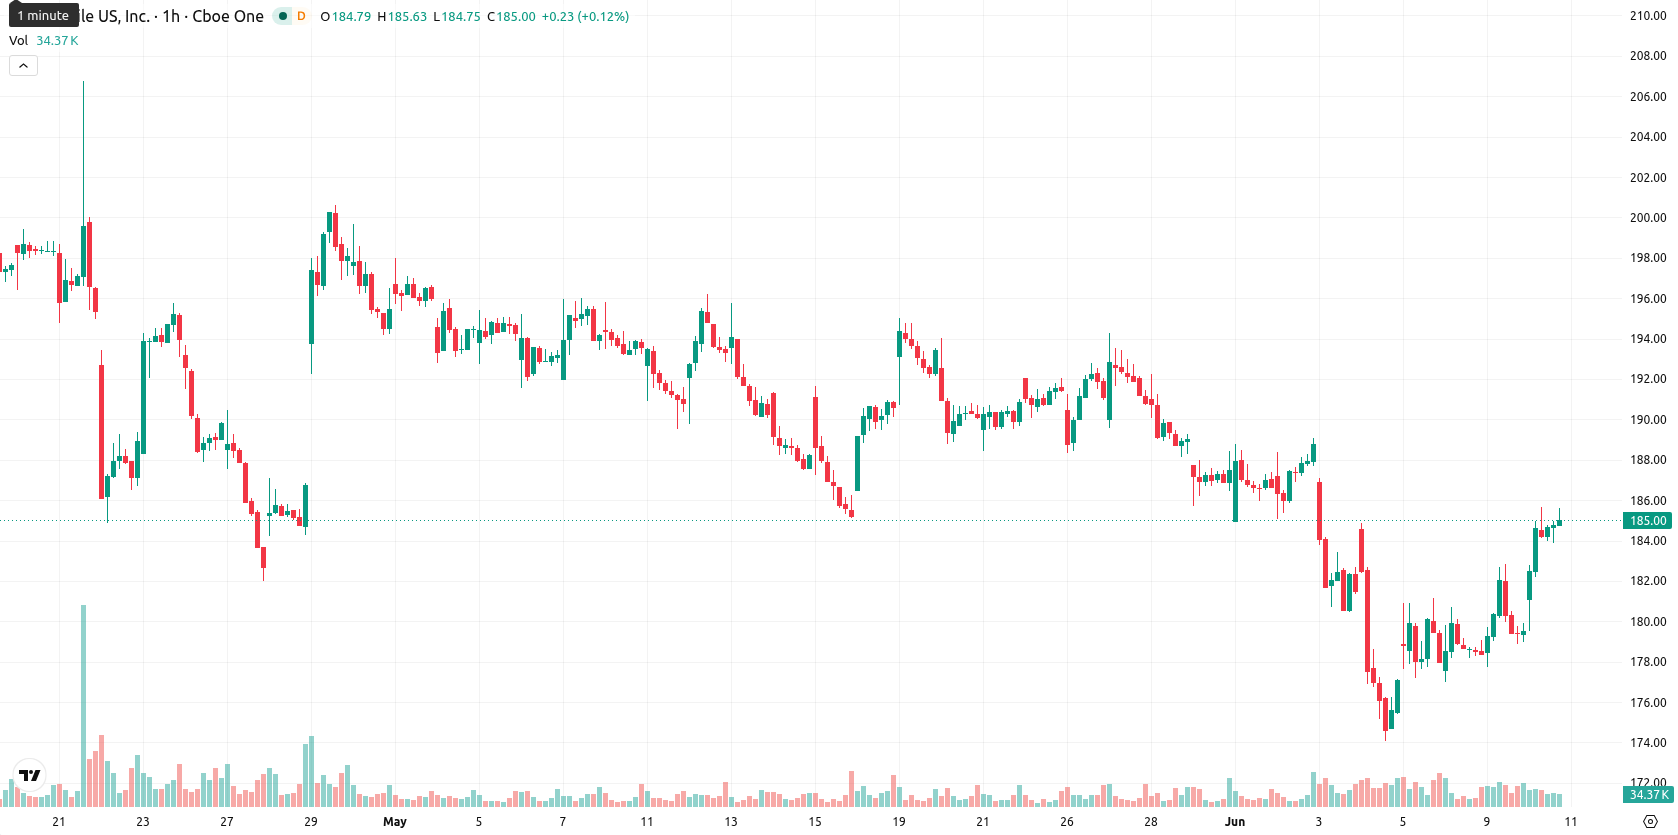
T-Mobile US, Inc. (TMUS) stock is trading at $185.02, advancing 3.1% on the session. The price sits above its key short- and medium-term moving averages, indicating robust momentum in the current trading environment.
Highlights
- T-Mobile's new internet plan restrictions are designed to shift subscriber behavior and may enhance revenue in targeted customer segments.
- Operational momentum is supported by TMUS expanding its technology team in India, while a major investor’s stake reduction adds trading uncertainty.
- TMUS shows strong short-term bullish momentum, with price expected to trade in the $180.16–$189.88 range as overbought signals increase the risk of a brief pullback.
Product overhaul and expansion shape flows amid investor repositioning
T-Mobile has introduced a new restriction on its internet plans, adapting its product offerings to better align with evolving consumer usage patterns as reported by thestreet.com. This move may impact subscriber behavior and revenue streams, potentially supporting demand in targeted segments. Additional operational momentum is provided by TMUS Global Solutions' expansion, including the relocation of its Hyderabad, India, development team to a new facility, which supports ongoing technology and engineering initiatives for the US market according to lightreading.com. Secondary developments such as a significant reduction in stake by Capital World Investors (MarketBeat) and industry collaboration efforts to combat telecom-related crime (phonearena.com) add further context to the current trading environment.
Buy signals persist as intraday indicators warn of overextension
On the technical front, TMUS is trading above the MA-20 ($180.88) and MA-50 ($181.41) on the hourly chart, while remaining below the long-term MA-200 ($209.41) on the daily timeframe. The Ichimoku Kijun at $181.26 now serves as immediate support. Among momentum indicators, MACD and the Awesome Oscillator both signal a Buy, while the ADX registers a Neutral trend. The RSI stands at 64.83 (Buy), with Stochastic RSI, CCI, and BBP all in overbought territory, reflecting strong intraday buying activity and potential for short-term retracement.
Range-bound volatility persists as outcome hinges on support resilience
In the next several sessions, TMUS is expected to fluctuate within the $180.16–$189.88 volatility band relative to current levels. The probability of continued gains is higher at 64%, with further upside likely if resistance at the upper end of the range is breached. If support at the Ichimoku Kijun level fails, a deeper correction toward the lower boundary could occur. The most probable scenario involves oscillation within this established corridor amid elevated volatility.
Previously it was reported that analysts maintained a cautious outlook on T-Mobile due to persistent technical weakness despite ongoing operational developments. The recent shift to strong short-term momentum and overbought signals introduces the possibility of a short-term rally, but traders should closely monitor for exhaustion risk as the price approaches the $189.88 resistance band.


-
 Afghanistan
-
 Albania
-
 Algeria
-
 Angola
-
 Argentina
-
 Armenia
-
 Australia
-
 Austria
-
 Azerbaijan
-
 Bahamas
-
 Bahrain
-
 Bangladesh
-
 Belarus
-
 Belgium
-
 Bolivia
-
 Botswana
-
 Brazil
-
 Brunei
-
 Bulgaria
-
 Cambodia
-
 Cameroon
-
 Canada
-
 Chile
Chile
-
 China
China
-
 Colombia
-
 Congo
Congo
-
 Costa Rica
-
 Cote d'Ivoire
-
 Croatia
-
 Cuba
Cuba
-
 Cyprus
-
 Czechia
-
 DR Congo
-
 Denmark
-
 Dominican Republic
-
 Ecuador
-
 Egypt
Egypt
-
 El Salvador
-
 Estonia
-
 Eswatini
-
 Ethiopia
-
 Finland
-
 France
-
 Georgia
-
 Germany
-
 Ghana
Ghana
-
 Greece
-
 Haiti
Haiti
-
 Hong Kong
-
 Hungary
-
 India
India
-
 Indonesia
-
 Iran, Islamic republic
-
 Iraq
Iraq
-
 Ireland
-
 Israel
-
 Italy
Italy
-
 Jamaica
-
 Japan
Japan
-
 Jordan
-
 Kazakhstan
-
 Kenya
Kenya
-
 Korea
Korea
-
 Kuwait
-
 Kyrgyzstan
-
 Laos
Laos
-
 Latvia
-
 Lebanon
-
 Lesotho
-
 Libya
Libya
-
 Lithuania
-
 Luxembourg
-
 Madagascar
-
 Malaysia
-
 Malta
Malta
-
 Mauritius
-
 Mexico
-
 Moldova
-
 Mongolia
-
 Montenegro
-
 Morocco
-
 Mozambique
-
 Myanmar
-
 Namibia
-
 Nepal
Nepal
-
 Netherlands
-
 New Zealand
-
 Nigeria
-
 North Macedonia
-
 Norway
-
 Oman
Oman
-
 Pakistan
-
 Palestine
-
 Panama
-
 Papua New Guinea
-
 Paraguay
-
 Peru
Peru
-
 Philippines
-
 Poland
-
 Portugal
-
 Puerto Rico
-
 Qatar
Qatar
-
 Reunion
-
 Romania
-
 Rwanda
-
 Saudi Arabia
-
 Serbia
-
 Singapore
-
 Slovakia
-
 Slovenia
-
 Somalia
-
 South Africa
-
 Spain
Spain
-
 Sri Lanka
-
 Sweden
-
 Switzerland
-
 Syria
Syria
-
 Taiwan
-
 Tajikistan
-
 Tanzania
-
 Thailand
-
 Trinidad and Tobago
-
 Tunisia
-
 Turkey
-
 UAE
UAE
-
 Uganda
-
 Ukraine
-
 United Kingdom
-
United States
-
 Uruguay
-
 Uzbekistan
-
 Venezuela
-
 Vietnam
-
 Yemen
Yemen
-
 Zambia
-
 Zimbabwe
- Forex
- Crypto
