
Interactive Brokers stock rises as Alternative Trading System attracts new liquidity partners

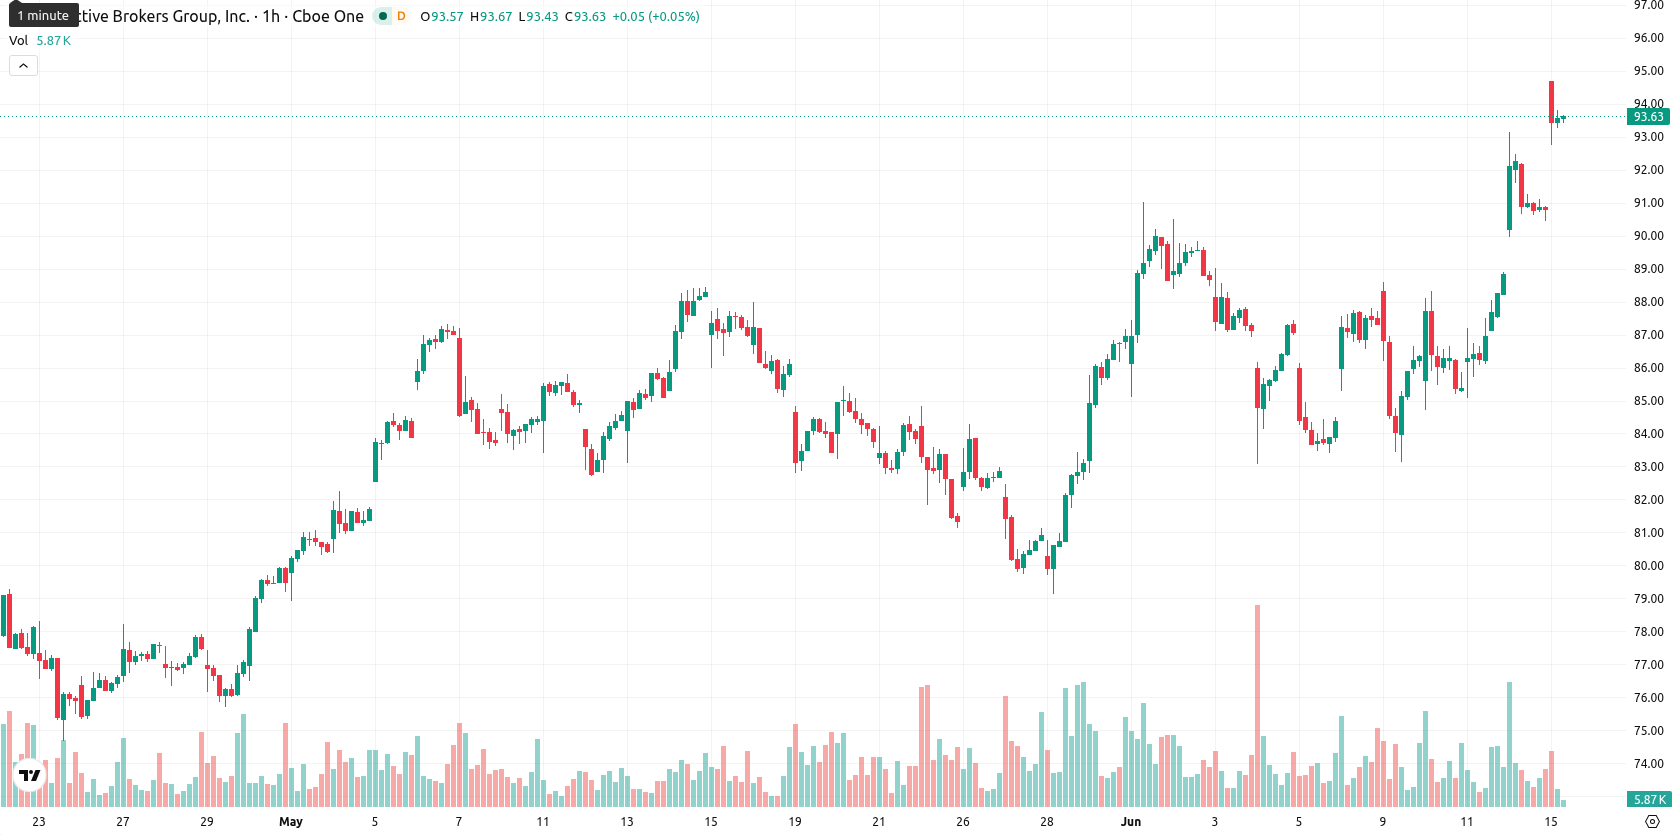
Interactive Brokers Group, Inc. (IBKR) stock is trading at $93.56, up 3.02% on the day. The stock sits above its key moving averages, reflecting firm positioning relative to recent trends.
Highlights
- Interactive Brokers integrates AI-powered trading via Claude, expanding automated and customized strategy access for clients.
- Service enhancements, including a stronger Alternative Trading System and Swedish securities lending, widen IBKR's institutional and retail appeal.
- IBKR trades in a strong bullish trend with overbought signals; next 2–3 day range expected between $89.16 and $97.96.
AI agentic trading rollout boosts demand amid broader platform upgrades
Interactive Brokers has launched AI-powered agentic trading by integrating directly with Claude, marking a significant step toward automated and enhanced trading experiences for its clients. This innovation is likely driving fresh demand by widening access to algorithmic trading and customized strategies on the IBKR platform. Additional advancements, including upgrades to the Alternative Trading System with new liquidity providers and order types, the improved Financial Advisor Portal, and the introduction of securities lending for Swedish stocks, further expand the breadth and efficiency of IBKR's service offering. Taken together, these corporate actions are reinforcing the company's appeal to both retail and institutional investors.
Overbought signals intensify as bullish momentum tests support zones
On the hourly chart, IBKR is trading above the MA-20 at $89.01 and the MA-50 at $87.13, with the price well above the daily MA-200 at $71.56. The Ichimoku Kijun level at $89.65 establishes immediate support. Momentum indicators show a strong bullish pattern: both MACD and ADX signal a buy, and the Awesome Oscillator confirms upward momentum. Oscillators such as RSI, CCI, Stoch RSI, and BBP are firmly in overbought territory, revealing that buyers are dominant but the risk of a short-term reversal is increasing. The price action is situated in the mid-range for today, reflecting notable but manageable volatility.
Consolidation expected as volatility persists and breakout risks rise
Over the next 2 to 3 trading days, the anticipated range for IBKR is $89.16 to $97.96, with volatility likely to remain elevated relative to recent sessions. The primary scenario is that the price will consolidate within this band as market participants digest recent developments. A break above the $97.96 resistance would open room for further gains, while a move below the $89.16 support could see the stock correcting toward lower levels.
Previously it was reported that Interactive Brokers maintained a broadly bullish technical posture, underscored by strong price momentum and expanding product offerings in Europe. The latest wave of technology-driven enhancements at IBKR, alongside current overbought conditions, suggests traders should monitor for potential volatility spikes and be prepared for short-term swings as the stock digests rapid recent gains.


Latest Interactive Brokers News


-
 Afghanistan
-
 Albania
-
 Algeria
-
 Angola
-
 Argentina
-
 Armenia
-
 Australia
-
 Austria
-
 Azerbaijan
-
 Bahamas
-
 Bahrain
-
 Bangladesh
-
 Belarus
-
 Belgium
-
 Bolivia
-
 Botswana
-
 Brazil
-
 Brunei
-
 Bulgaria
-
 Cambodia
-
 Cameroon
-
 Canada
-
 Chile
Chile
-
 China
China
-
 Colombia
-
 Congo
Congo
-
 Costa Rica
-
 Cote d'Ivoire
-
 Croatia
-
 Cuba
Cuba
-
 Cyprus
-
 Czechia
-
 DR Congo
-
 Denmark
-
 Dominican Republic
-
 Ecuador
-
 Egypt
Egypt
-
 El Salvador
-
 Estonia
-
 Eswatini
-
 Ethiopia
-
 Finland
-
 France
-
 Georgia
-
 Germany
-
 Ghana
Ghana
-
 Greece
-
 Haiti
Haiti
-
 Hong Kong
-
 Hungary
-
 India
India
-
 Indonesia
-
 Iran, Islamic republic
-
 Iraq
Iraq
-
 Ireland
-
 Israel
-
 Italy
Italy
-
 Jamaica
-
 Japan
Japan
-
 Jordan
-
 Kazakhstan
-
 Kenya
Kenya
-
 Korea
Korea
-
 Kuwait
-
 Kyrgyzstan
-
 Laos
Laos
-
 Latvia
-
 Lebanon
-
 Lesotho
-
 Libya
Libya
-
 Lithuania
-
 Luxembourg
-
 Madagascar
-
 Malaysia
-
 Malta
Malta
-
 Mauritius
-
 Mexico
-
 Moldova
-
 Mongolia
-
 Montenegro
-
 Morocco
-
 Mozambique
-
 Myanmar
-
 Namibia
-
 Nepal
Nepal
-
 Netherlands
-
 New Zealand
-
 Nigeria
-
 North Macedonia
-
 Norway
-
 Oman
Oman
-
 Pakistan
-
 Palestine
-
 Panama
-
 Papua New Guinea
-
 Paraguay
-
 Peru
Peru
-
 Philippines
-
 Poland
-
 Portugal
-
 Puerto Rico
-
 Qatar
Qatar
-
 Reunion
-
 Romania
-
 Rwanda
-
 Saudi Arabia
-
 Serbia
-
 Singapore
-
 Slovakia
-
 Slovenia
-
 Somalia
-
 South Africa
-
 Spain
Spain
-
 Sri Lanka
-
 Sweden
-
 Switzerland
-
 Syria
Syria
-
 Taiwan
-
 Tajikistan
-
 Tanzania
-
 Thailand
-
 Trinidad and Tobago
-
 Tunisia
-
 Turkey
-
 UAE
UAE
-
 Uganda
-
 Ukraine
-
 United Kingdom
-
United States
-
 Uruguay
-
 Uzbekistan
-
 Venezuela
-
 Vietnam
-
 Yemen
Yemen
-
 Zambia
-
 Zimbabwe
- Forex
- Crypto
