
Sundial Growers stock consolidates as price holds below long-term average

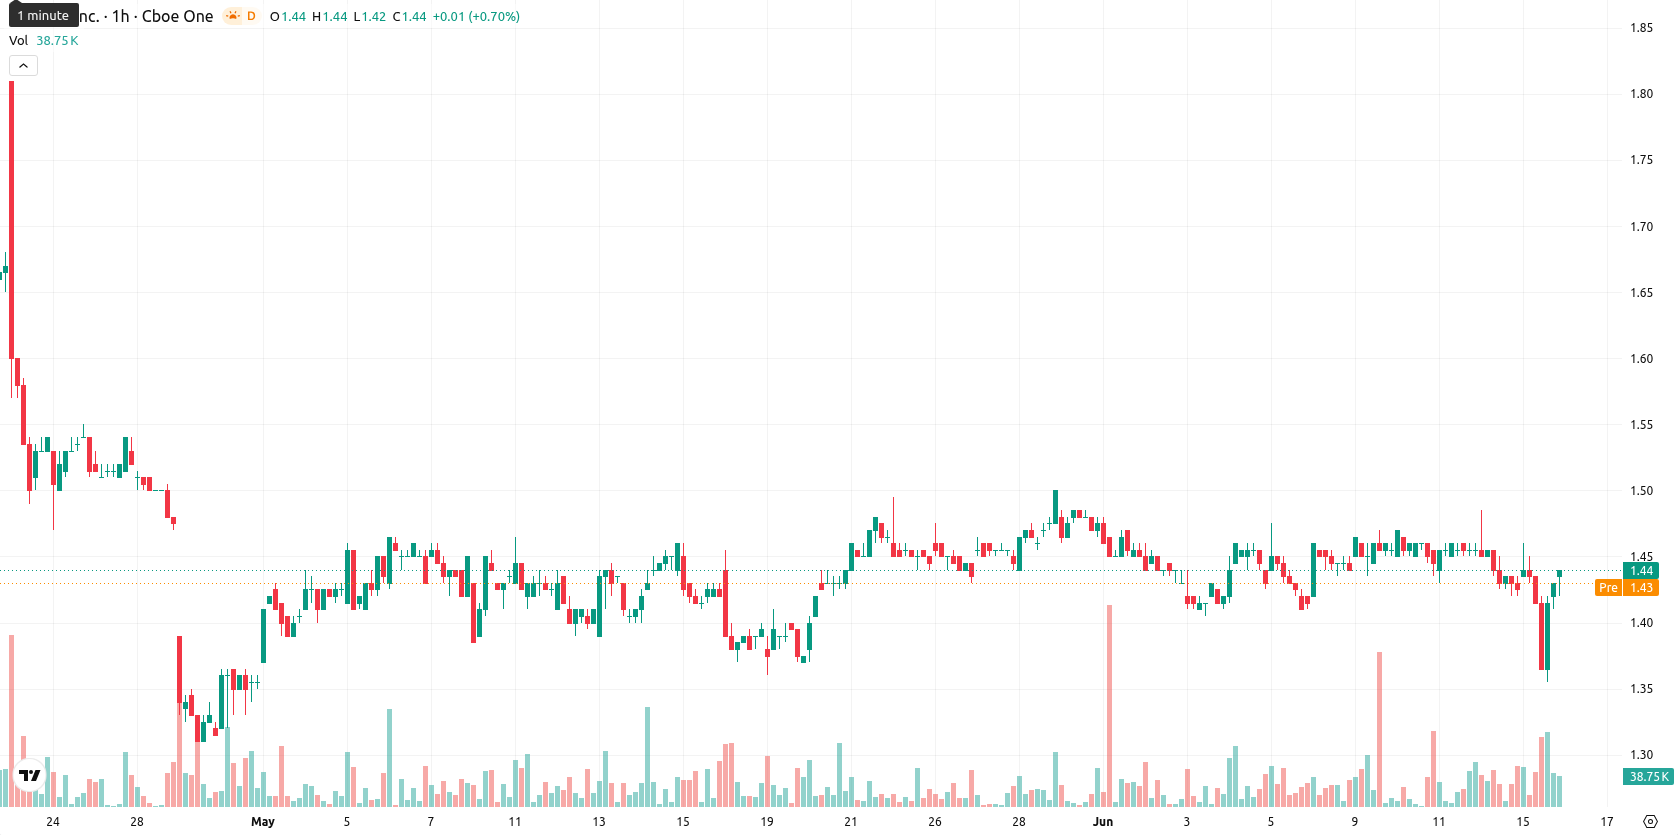
Sundial Growers Inc. (SNDL) stock is trading at $1.44, marking a 0.70% gain day-over-day and opening higher by $0.02. The share price sits above its key short- and medium-term moving averages but remains beneath longer-term benchmarks.
Highlights
- SNDL shows short- and medium-term strength above key moving averages but remains confined within a broader bearish trend.
- Momentum indicators present mixed signals, with intraday trading driven by high volatility and buyer dominance but signs of short-term exhaustion.
- Price is expected to consolidate within the $1.36–$1.49 range, with a 65% chance of downside unless resistance at $1.49 breaks decisively.
Momentum divided as upside levels confront mixed indicator signals
The MA-20 and MA-50 moving averages on the hourly chart have both been crossed to the upside, while the MA-200 remains overhead. Immediate support is identified at the Ichimoku Kijun level of $1.42. The $1.49 level serves as the initial resistance, while a drop toward $1.36 would retest the lower support band. Momentum readings are mixed: the MACD and Awesome Oscillator generate Sell signals, RSI registers at 49.68 (Sell), and Stoch RSI is Overbought, pointing to short-term exhaustion. The ADX and CCI are Neutral, but the BBP indicates strong intraday buyer dominance amid heightened volatility.
Downside risk prevails as trading range narrows for SNDL
Over the next several sessions, SNDL is expected to consolidate within a typical volatility band ranging from $1.36 to $1.49. Scenarios skew moderately to the downside, with a 35% probability of an upward move and a 65% chance of a downward move. A breakout above $1.49 would shift momentum to the upside and target further gains, whereas a move below $1.36 support would indicate renewed downside risk.
Earlier, analysts noted that Sundial Growers was experiencing persistent downside momentum with limited prospects for a near-term recovery. While the current technical landscape signals continued caution, traders should closely monitor price action around the $1.49 resistance and $1.36 support levels for signs of a decisive breakout or renewed selling pressure.


-
 Afghanistan
-
 Albania
-
 Algeria
-
 Angola
-
 Argentina
-
 Armenia
-
 Australia
-
 Austria
-
 Azerbaijan
-
 Bahamas
-
 Bahrain
-
 Bangladesh
-
 Belarus
-
 Belgium
-
 Bolivia
-
 Botswana
-
 Brazil
-
 Brunei
-
 Bulgaria
-
 Cambodia
-
 Cameroon
-
 Canada
-
 Chile
Chile
-
 China
China
-
 Colombia
-
 Congo
Congo
-
 Costa Rica
-
 Cote d'Ivoire
-
 Croatia
-
 Cuba
Cuba
-
 Cyprus
-
 Czechia
-
 DR Congo
-
 Denmark
-
 Dominican Republic
-
 Ecuador
-
 Egypt
Egypt
-
 El Salvador
-
 Estonia
-
 Eswatini
-
 Ethiopia
-
 Finland
-
 France
-
 Georgia
-
 Germany
-
 Ghana
Ghana
-
 Greece
-
 Haiti
Haiti
-
 Hong Kong
-
 Hungary
-
 India
India
-
 Indonesia
-
 Iran, Islamic republic
-
 Iraq
Iraq
-
 Ireland
-
 Israel
-
 Italy
Italy
-
 Jamaica
-
 Japan
Japan
-
 Jordan
-
 Kazakhstan
-
 Kenya
Kenya
-
 Korea
Korea
-
 Kuwait
-
 Kyrgyzstan
-
 Laos
Laos
-
 Latvia
-
 Lebanon
-
 Lesotho
-
 Libya
Libya
-
 Lithuania
-
 Luxembourg
-
 Madagascar
-
 Malaysia
-
 Malta
Malta
-
 Mauritius
-
 Mexico
-
 Moldova
-
 Mongolia
-
 Montenegro
-
 Morocco
-
 Mozambique
-
 Myanmar
-
 Namibia
-
 Nepal
Nepal
-
 Netherlands
-
 New Zealand
-
 Nigeria
-
 North Macedonia
-
 Norway
-
 Oman
Oman
-
 Pakistan
-
 Palestine
-
 Panama
-
 Papua New Guinea
-
 Paraguay
-
 Peru
Peru
-
 Philippines
-
 Poland
-
 Portugal
-
 Puerto Rico
-
 Qatar
Qatar
-
 Reunion
-
 Romania
-
 Rwanda
-
 Saudi Arabia
-
 Serbia
-
 Singapore
-
 Slovakia
-
 Slovenia
-
 Somalia
-
 South Africa
-
 Spain
Spain
-
 Sri Lanka
-
 Sweden
-
 Switzerland
-
 Syria
Syria
-
 Taiwan
-
 Tajikistan
-
 Tanzania
-
 Thailand
-
 Trinidad and Tobago
-
 Tunisia
-
 Turkey
-
 UAE
UAE
-
 Uganda
-
 Ukraine
-
 United Kingdom
-
United States
-
 Uruguay
-
 Uzbekistan
-
 Venezuela
-
 Vietnam
-
 Yemen
Yemen
-
 Zambia
-
 Zimbabwe
- Forex
- Crypto
