
No major move for Apple stock as $301.86 resistance caps upside

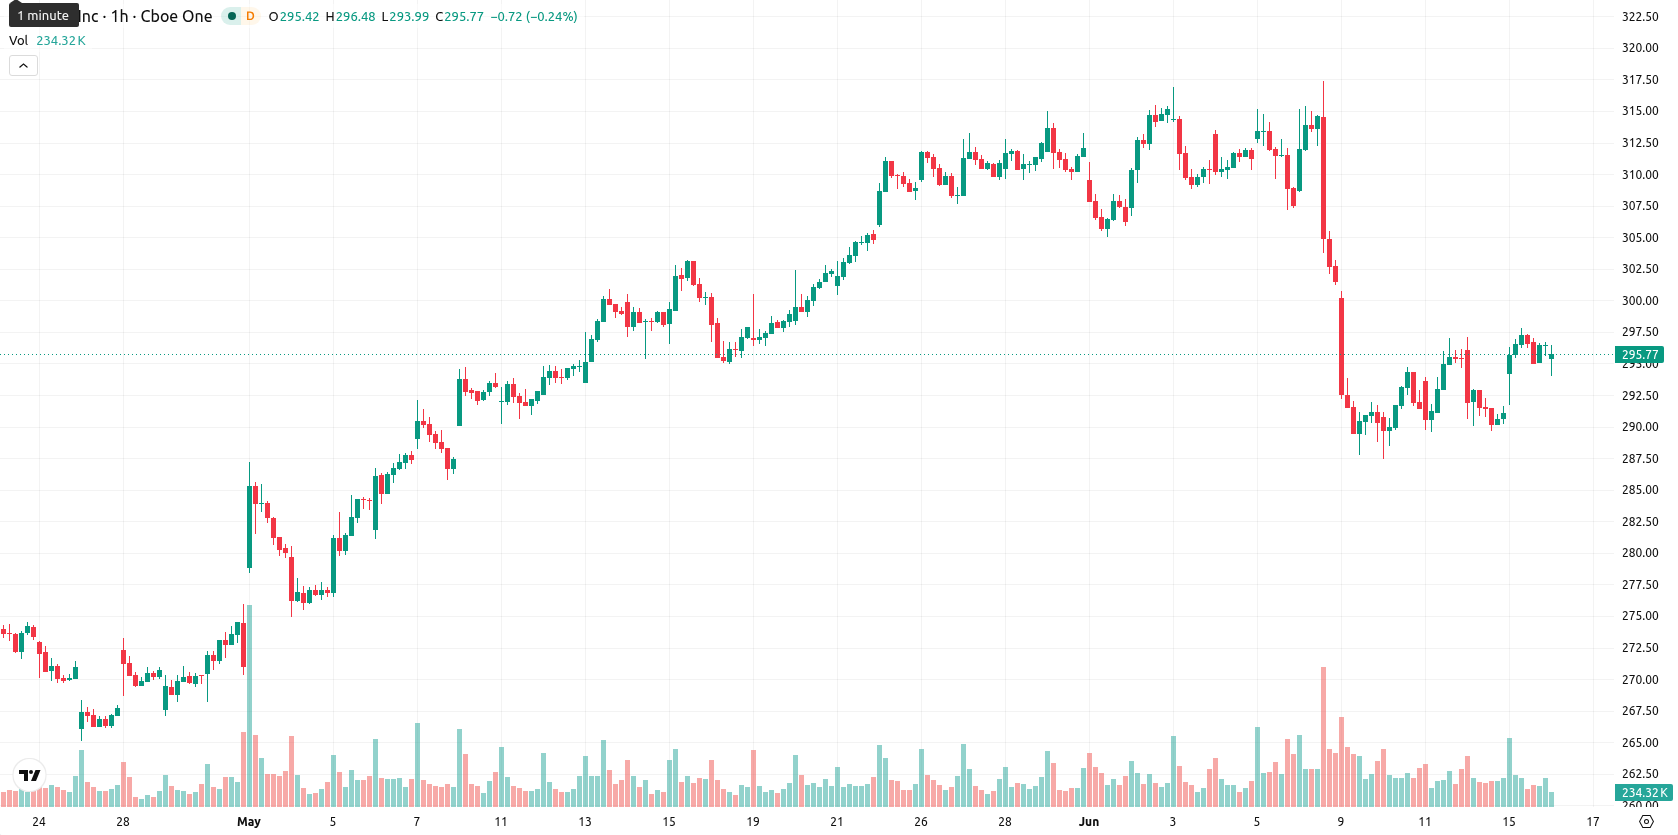
Apple Inc. (AAPL) stock is trading at $297.22, registering a daily gain of 0.36%. The price holds above its key moving averages on both the short and long timeframes, reflecting a supportive technical backdrop.
Highlights
- Italy's competition regulator has launched a formal probe into Apple's compliance with the EU Digital Markets Act, focusing on cloud service interoperability in iOS and iPadOS.
- This regulatory action intensifies scrutiny of Apple's EU business practices, introducing uncertainty around potential changes to its regional software ecosystem.
- AAPL trades near $297.22 in a bullish technical structure, but mixed indicator signals suggest a likely sideways move within the $292.58–$301.86 short-term range.
EU regulatory probe intensifies operational risk for Apple's ecosystem
Italy's competition regulator has initiated a formal investigation into Apple's compliance with interoperability obligations set by the European Union's Digital Markets Act, focusing specifically on third-party consumer cloud services and their integration with Apple's iOS and iPadOS platforms. This regulatory action elevates scrutiny over Apple's operational practices in the EU, introducing possible implications for its software ecosystem and future service offerings, as reported by Italian authorities. The development could affect sentiment by introducing uncertainty over potential adjustments to Apple's business model in the region.
Bullish signals split as momentum softens on conflicting indicators
On the H1 (hourly) chart, AAPL is positioned above the MA-20 and MA-50, with the daily price well above the MA-200, confirming technical strength across timeframes. The Ichimoku Kijun line at $293.69 serves as immediate support. Key technical indicators are split: RSI and CCI signal Buy, pointing toward bullish momentum, while Stoch RSI is at Strong Sell and BBP is overbought, highlighting stretched short-term conditions. MACD and Awesome Oscillator are neutral, and ADX signals a Sell, suggesting mixed or weakening trend strength.
Downside risk grows as AAPL consolidates within defined volatility band
In the short term, AAPL is likely to trade within a volatility band defined by $292.58 as support and $301.86 as resistance. With a 37% probability of an upside breakout and a 63% chance of a downward move, the base case expects price consolidation inside the current range. A break above $301.86 would open the path for renewed bullish momentum, while a sustained drop below $292.58 would indicate a bearish shift, making downside risk more prominent over the next several sessions.
In a recent review, analysts noted that Apple's long-term uptrend remained intact despite short-term consolidation and muted market reactions to major product announcements. The initiation of an EU antitrust probe adds regulatory uncertainty to the outlook and positions near-term price action at a pivotal juncture, making $292.58 a crucial support level for traders to monitor as sentiment evolves.


-
 Afghanistan
-
 Albania
-
 Algeria
-
 Angola
-
 Argentina
-
 Armenia
-
 Australia
-
 Austria
-
 Azerbaijan
-
 Bahamas
-
 Bahrain
-
 Bangladesh
-
 Belarus
-
 Belgium
-
 Bolivia
-
 Botswana
-
 Brazil
-
 Brunei
-
 Bulgaria
-
 Cambodia
-
 Cameroon
-
 Canada
-
 Chile
Chile
-
 China
China
-
 Colombia
-
 Congo
Congo
-
 Costa Rica
-
 Cote d'Ivoire
-
 Croatia
-
 Cuba
Cuba
-
 Cyprus
-
 Czechia
-
 DR Congo
-
 Denmark
-
 Dominican Republic
-
 Ecuador
-
 Egypt
Egypt
-
 El Salvador
-
 Estonia
-
 Eswatini
-
 Ethiopia
-
 Finland
-
 France
-
 Georgia
-
 Germany
-
 Ghana
Ghana
-
 Greece
-
 Haiti
Haiti
-
 Hong Kong
-
 Hungary
-
 India
India
-
 Indonesia
-
 Iran, Islamic republic
-
 Iraq
Iraq
-
 Ireland
-
 Israel
-
 Italy
Italy
-
 Jamaica
-
 Japan
Japan
-
 Jordan
-
 Kazakhstan
-
 Kenya
Kenya
-
 Korea
Korea
-
 Kuwait
-
 Kyrgyzstan
-
 Laos
Laos
-
 Latvia
-
 Lebanon
-
 Lesotho
-
 Libya
Libya
-
 Lithuania
-
 Luxembourg
-
 Madagascar
-
 Malaysia
-
 Malta
Malta
-
 Mauritius
-
 Mexico
-
 Moldova
-
 Mongolia
-
 Montenegro
-
 Morocco
-
 Mozambique
-
 Myanmar
-
 Namibia
-
 Nepal
Nepal
-
 Netherlands
-
 New Zealand
-
 Nigeria
-
 North Macedonia
-
 Norway
-
 Oman
Oman
-
 Pakistan
-
 Palestine
-
 Panama
-
 Papua New Guinea
-
 Paraguay
-
 Peru
Peru
-
 Philippines
-
 Poland
-
 Portugal
-
 Puerto Rico
-
 Qatar
Qatar
-
 Reunion
-
 Romania
-
 Rwanda
-
 Saudi Arabia
-
 Serbia
-
 Singapore
-
 Slovakia
-
 Slovenia
-
 Somalia
-
 South Africa
-
 Spain
Spain
-
 Sri Lanka
-
 Sweden
-
 Switzerland
-
 Syria
Syria
-
 Taiwan
-
 Tajikistan
-
 Tanzania
-
 Thailand
-
 Trinidad and Tobago
-
 Tunisia
-
 Turkey
-
 UAE
UAE
-
 Uganda
-
 Ukraine
-
 United Kingdom
-
United States
-
 Uruguay
-
 Uzbekistan
-
 Venezuela
-
 Vietnam
-
 Yemen
Yemen
-
 Zambia
-
 Zimbabwe
- Forex
- Crypto
