
Meta stock climbs as first-quarter earnings surpass expectations: weekly outlook

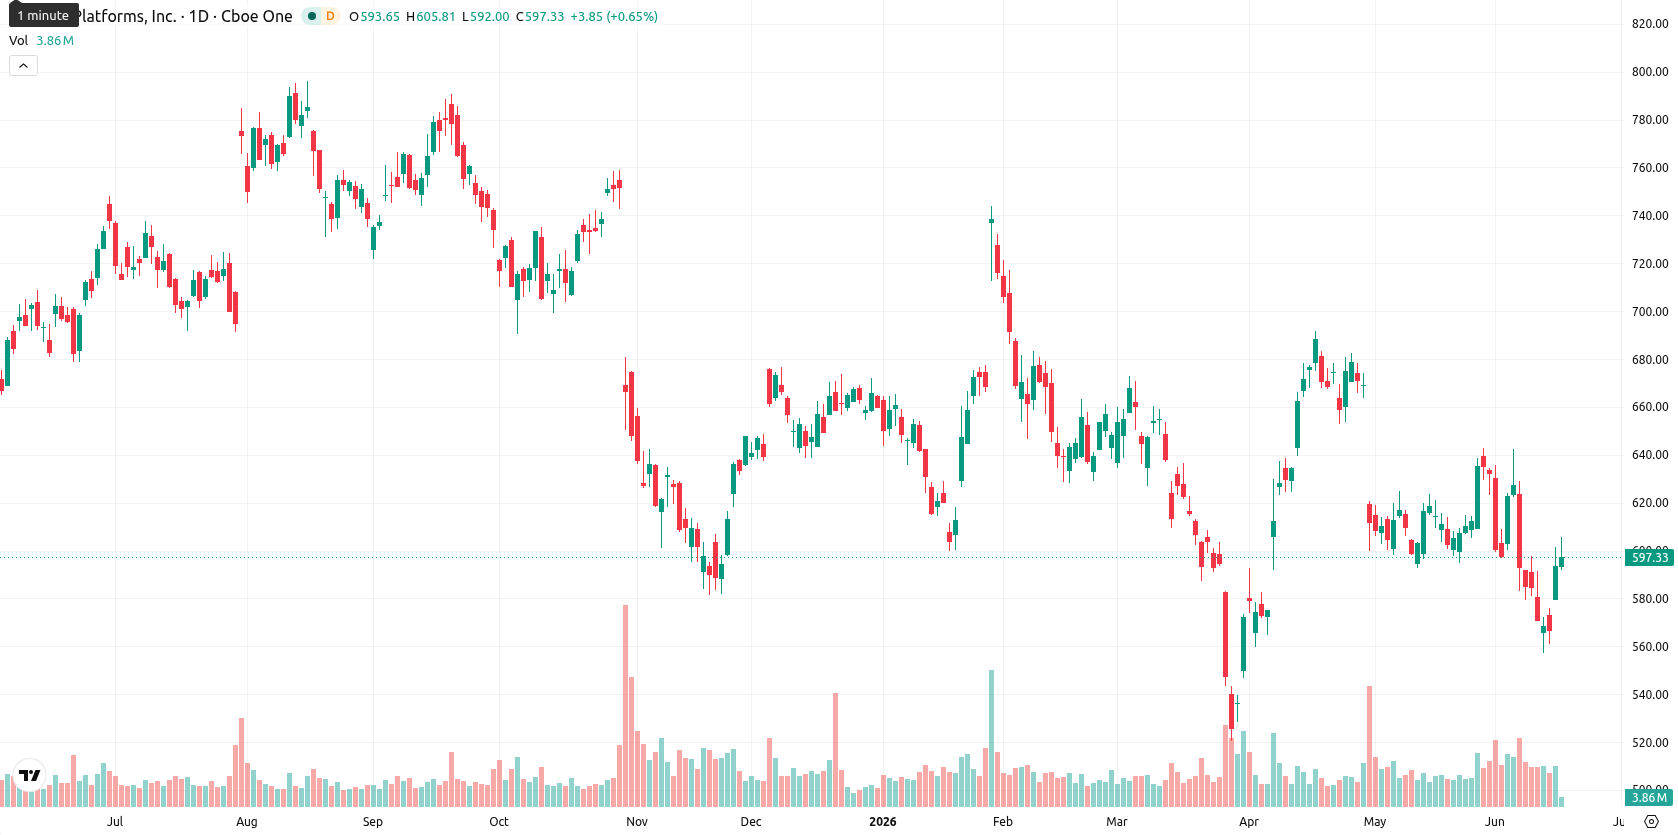
Meta Platforms, Inc. (META, formerly Facebook, Inc.) ended the week at $597.26, gaining $29.99 (5.42%) over the last 7 days. The stock is trading below its weekly MA-20 ($618.63) and MA-50 ($665.38), but remains well above the MA-200 ($464.81), indicating ongoing medium-term selling pressure while longer-term support holds.
Highlights
- Meta is experiencing medium-term selling pressure, currently trading below key moving averages with longer-term support intact.
- Momentum indicators, including MACD and ADX, indicate weak and bearish sentiment, suggesting downside or sideways price action persists.
- Expected trading range for the next week is $594.50 to $604.80, with downside risk favored and breakout above $604.80 required for bullish confirmation.
AI-driven growth and strong results boost institutional interest this week
Meta posted a strong first-quarter 2026 result, with revenue reaching $56.31 billion, up 33% year over year, and earnings per share topping analyst estimates. The company raised its 2026 capital expenditure guidance to between $125 billion and $145 billion to support continued investment in artificial intelligence infrastructure. Recent developments also include workforce restructuring focused on AI priorities and a rise in the number of hedge funds holding Meta shares.
Bearish momentum and oversold signals amid resistance and weak trend
On the weekly chart, the price remains under the MA-20 and MA-50, which act as dynamic resistance, but is above the long-term MA-200, highlighting a balance between medium-term pressure and longer-term support. The MACD signals a bearish trend, and the ADX shows weak directionality, while both RSI and Commodity Channel Index suggest further downside or consolidation. Bull/Bear Power highlights pronounced oversold conditions and persistent seller dominance, although the Stochastic RSI gives a mild buy signal with low conviction. Weekly volatility stands at 7.92% and the stock closed near the upper end of the range.
Sideways to mild downside bias as breakout risks remain limited
In the next five trading days, META is expected to trade between $594.50 and $604.80 based on weekly data. The most probable scenario is sideways or slightly downward movement, with less than a 20% chance of a sustained rally as no key weekly indicators presently signal a strong buy. Upside requires a clear breakout above $604.80, while a drop below $594.50 would signal renewed bearish momentum. Current W1 momentum warns of continued caution rather than a decisive directional move.
Earlier, analysts noted that Meta’s robust financial results and aggressive AI investments were driving positive momentum, while also highlighting potential risks tied to elevated infrastructure spending. The current setup points to persistent caution as medium-term selling pressure continues, making a confirmed breakout above $604.80 the key trigger for any renewed upside.


-
 Afghanistan
-
 Albania
-
 Algeria
-
 Angola
-
 Argentina
-
 Armenia
-
 Australia
-
 Austria
-
 Azerbaijan
-
 Bahamas
-
 Bahrain
-
 Bangladesh
-
 Belarus
-
 Belgium
-
 Bolivia
-
 Botswana
-
 Brazil
-
 Brunei
-
 Bulgaria
-
 Cambodia
-
 Cameroon
-
 Canada
-
 Chile
Chile
-
 China
China
-
 Colombia
-
 Congo
Congo
-
 Costa Rica
-
 Cote d'Ivoire
-
 Croatia
-
 Cuba
Cuba
-
 Cyprus
-
 Czechia
-
 DR Congo
-
 Denmark
-
 Dominican Republic
-
 Ecuador
-
 Egypt
Egypt
-
 El Salvador
-
 Estonia
-
 Eswatini
-
 Ethiopia
-
 Finland
-
 France
-
 Georgia
-
 Germany
-
 Ghana
Ghana
-
 Greece
-
 Haiti
Haiti
-
 Hong Kong
-
 Hungary
-
 India
India
-
 Indonesia
-
 Iran, Islamic republic
-
 Iraq
Iraq
-
 Ireland
-
 Israel
-
 Italy
Italy
-
 Jamaica
-
 Japan
Japan
-
 Jordan
-
 Kazakhstan
-
 Kenya
Kenya
-
 Korea
Korea
-
 Kuwait
-
 Kyrgyzstan
-
 Laos
Laos
-
 Latvia
-
 Lebanon
-
 Lesotho
-
 Libya
Libya
-
 Lithuania
-
 Luxembourg
-
 Madagascar
-
 Malaysia
-
 Malta
Malta
-
 Mauritius
-
 Mexico
-
 Moldova
-
 Mongolia
-
 Montenegro
-
 Morocco
-
 Mozambique
-
 Myanmar
-
 Namibia
-
 Nepal
Nepal
-
 Netherlands
-
 New Zealand
-
 Nigeria
-
 North Macedonia
-
 Norway
-
 Oman
Oman
-
 Pakistan
-
 Palestine
-
 Panama
-
 Papua New Guinea
-
 Paraguay
-
 Peru
Peru
-
 Philippines
-
 Poland
-
 Portugal
-
 Puerto Rico
-
 Qatar
Qatar
-
 Reunion
-
 Romania
-
 Rwanda
-
 Saudi Arabia
-
 Serbia
-
 Singapore
-
 Slovakia
-
 Slovenia
-
 Somalia
-
 South Africa
-
 Spain
Spain
-
 Sri Lanka
-
 Sweden
-
 Switzerland
-
 Syria
Syria
-
 Taiwan
-
 Tajikistan
-
 Tanzania
-
 Thailand
-
 Trinidad and Tobago
-
 Tunisia
-
 Turkey
-
 UAE
UAE
-
 Uganda
-
 Ukraine
-
 United Kingdom
-
United States
-
 Uruguay
-
 Uzbekistan
-
 Venezuela
-
 Vietnam
-
 Yemen
Yemen
-
 Zambia
-
 Zimbabwe
- Forex
- Crypto
