
Broadcom stock price forecast: $377.99 support in focus as AVGO slides 4.1%

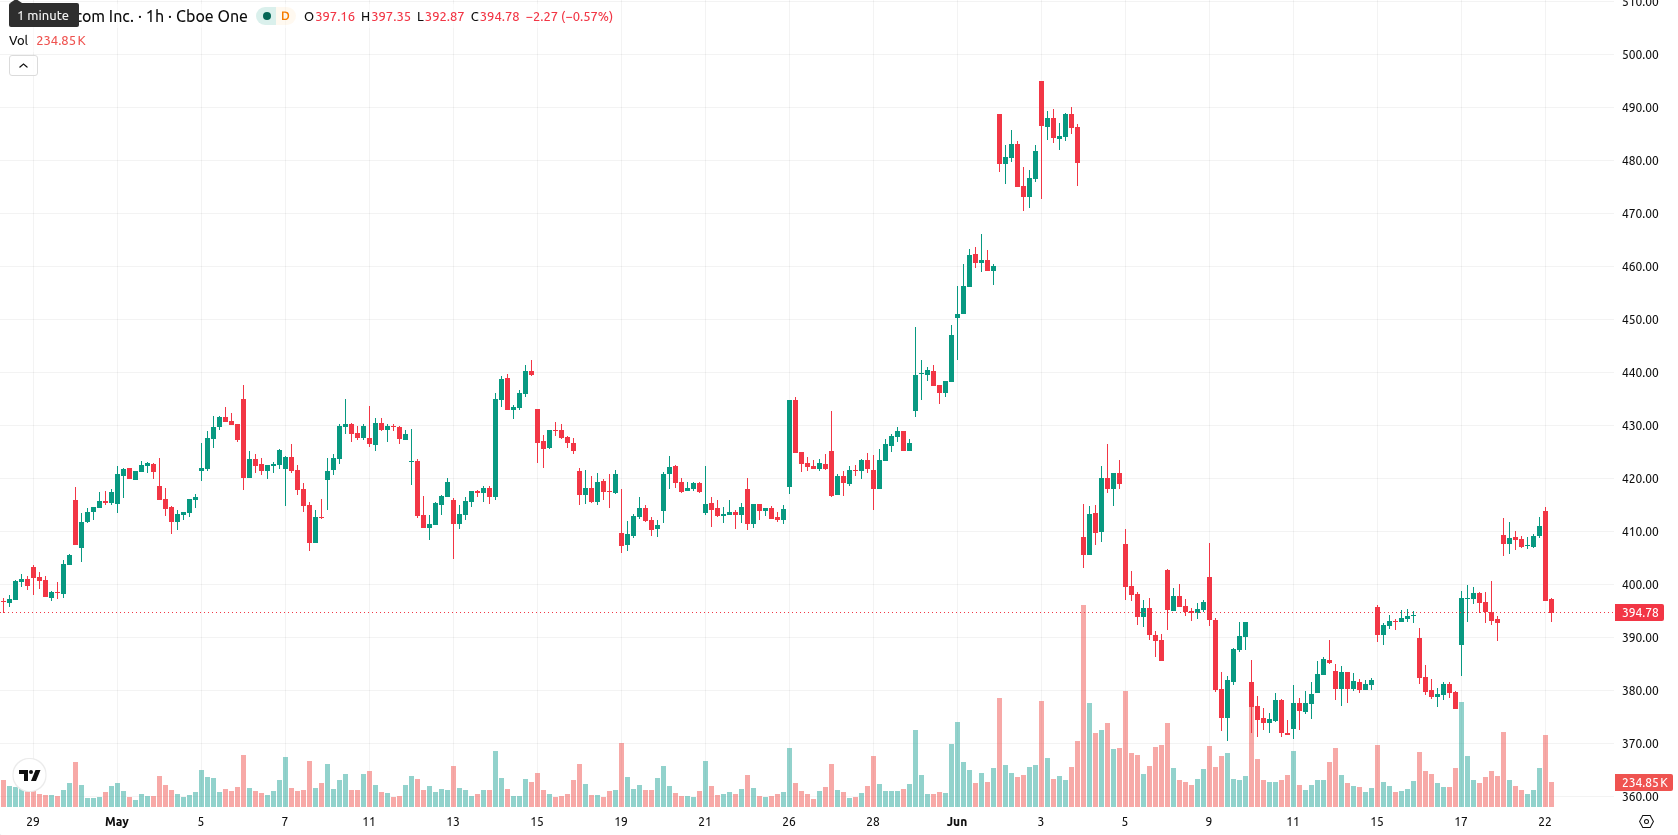
Broadcom Inc. (AVGO) stock is trading at $394.09 following a 4.1% decline for the day, closing near the session low. The stock is currently positioned below its short-term averages but continues to hold above key medium- and long-term averages.
Highlights
- Broadcom's Q2 AI semiconductor revenue surged 143% year over year to $10.8 billion, surpassing earnings expectations.
- Total revenue reached $22.19 billion with continued dividend payouts, reinforcing robust operational execution and financial strength despite recent selling pressure.
- Technicals indicate short-term weakness within a $377.99–$411.64 range, with momentum signals bullish but overbought oscillators suggesting near-term volatility and potential consolidation.
Analyst optimism meets selling as robust earnings outpace stock reaction
Broadcom Inc. reported quarterly earnings of $2.44 per share on June 21, 2026, exceeding consensus forecasts and demonstrating realized profitability above expectations. Q2 results showed AI semiconductor revenue rising 143% year over year to $10.8 billion and total revenue reaching $22.19 billion, both metrics underscoring robust demand and operational scale. The company also declared a quarterly dividend of $0.65 per share, payable on June 30, 2026, while maintaining a market capitalization of $1.96 trillion and a P/E ratio of 68.56; according to Americanbankingnews, these outcomes provide context for recent market valuation and highlight Broadcom's current financial standing, though price action has remained under broader selling pressure.
Upside momentum diverges from overbought technical signals
On the technical side, AVGO has closed below its MA-20 at $394.09, while remaining above both the MA-50 and MA-200 on the chart. Immediate resistance is identified at the Ichimoku Kijun level of $394.49, with established support at $377.99 and resistance up to $411.64. Momentum readings are positive, as signaled by MACD and ADX Buy signals. However, oscillators including RSI at 70.08, Stoch RSI, and CCI all register overbought territory, and Bull/Bear Power reflects strong intraday buying, while Awesome Oscillator remains neutral. This combination highlights a divergence between upside momentum and stretched overbought conditions.
Sideways trading likely as bullish momentum clashes with overbought risk
Over the next several days, AVGO is likely to trade within a typical volatility band of $377.99 to $411.64. The prevailing scenario is for sideways movement inside this corridor, given the divergence between bullish momentum and overbought oscillator signals. Should price break upward through the immediate resistance around the Kijun, further gains toward the upper range are possible. Alternatively, a sustained move below support would risk a broader retracement toward the lower boundary of the established range.
Previously it was reported that Broadcom maintained a constructive outlook, supported by robust AI-driven growth and positive technical momentum. The current setup reinforces this bullish foundation, but with overbought conditions now present, traders should monitor for a potential breakout above immediate resistance or a reversal toward established support as momentum and volatility converge.


-
 Afghanistan
-
 Albania
-
 Algeria
-
 Angola
-
 Argentina
-
 Armenia
-
 Australia
-
 Austria
-
 Azerbaijan
-
 Bahamas
-
 Bahrain
-
 Bangladesh
-
 Belarus
-
 Belgium
-
 Bolivia
-
 Botswana
-
 Brazil
-
 Brunei
-
 Bulgaria
-
 Cambodia
-
 Cameroon
-
 Canada
-
 Chile
Chile
-
 China
China
-
 Colombia
-
 Congo
Congo
-
 Costa Rica
-
 Cote d'Ivoire
-
 Croatia
-
 Cuba
Cuba
-
 Cyprus
-
 Czechia
-
 DR Congo
-
 Denmark
-
 Dominican Republic
-
 Ecuador
-
 Egypt
Egypt
-
 El Salvador
-
 Estonia
-
 Eswatini
-
 Ethiopia
-
 Finland
-
 France
-
 Georgia
-
 Germany
-
 Ghana
Ghana
-
 Greece
-
 Haiti
Haiti
-
 Hong Kong
-
 Hungary
-
 India
India
-
 Indonesia
-
 Iran, Islamic republic
-
 Iraq
Iraq
-
 Ireland
-
 Israel
-
 Italy
Italy
-
 Jamaica
-
 Japan
Japan
-
 Jordan
-
 Kazakhstan
-
 Kenya
Kenya
-
 Korea
Korea
-
 Kuwait
-
 Kyrgyzstan
-
 Laos
Laos
-
 Latvia
-
 Lebanon
-
 Lesotho
-
 Libya
Libya
-
 Lithuania
-
 Luxembourg
-
 Madagascar
-
 Malaysia
-
 Malta
Malta
-
 Mauritius
-
 Mexico
-
 Moldova
-
 Mongolia
-
 Montenegro
-
 Morocco
-
 Mozambique
-
 Myanmar
-
 Namibia
-
 Nepal
Nepal
-
 Netherlands
-
 New Zealand
-
 Nigeria
-
 North Macedonia
-
 Norway
-
 Oman
Oman
-
 Pakistan
-
 Palestine
-
 Panama
-
 Papua New Guinea
-
 Paraguay
-
 Peru
Peru
-
 Philippines
-
 Poland
-
 Portugal
-
 Puerto Rico
-
 Qatar
Qatar
-
 Reunion
-
 Romania
-
 Rwanda
-
 Saudi Arabia
-
 Serbia
-
 Singapore
-
 Slovakia
-
 Slovenia
-
 Somalia
-
 South Africa
-
 Spain
Spain
-
 Sri Lanka
-
 Sweden
-
 Switzerland
-
 Syria
Syria
-
 Taiwan
-
 Tajikistan
-
 Tanzania
-
 Thailand
-
 Trinidad and Tobago
-
 Tunisia
-
 Turkey
-
 UAE
UAE
-
 Uganda
-
 Ukraine
-
 United Kingdom
-
United States
-
 Uruguay
-
 Uzbekistan
-
 Venezuela
-
 Vietnam
-
 Yemen
Yemen
-
 Zambia
-
 Zimbabwe
- Forex
- Crypto
